Bakersfield, CA Pollen and Allergy Report for Summer 2023

Pollen Allergy Trends in Bakersfield, CA
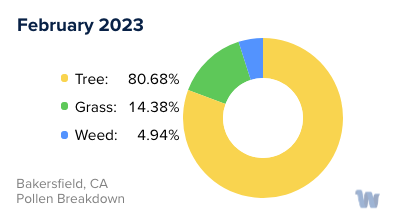
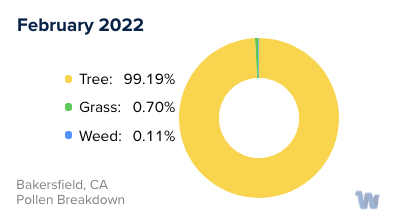
When is pollen lowest in Bakersfield, CA?
February
Lowest month total PPM
Avg. PPM
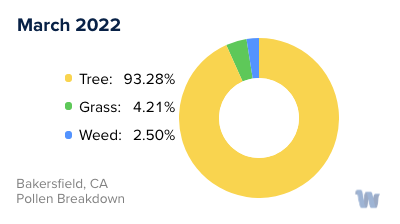
When is pollen highest in Bakersfield, CA?
March
Highest month total PPM
Avg. PPM
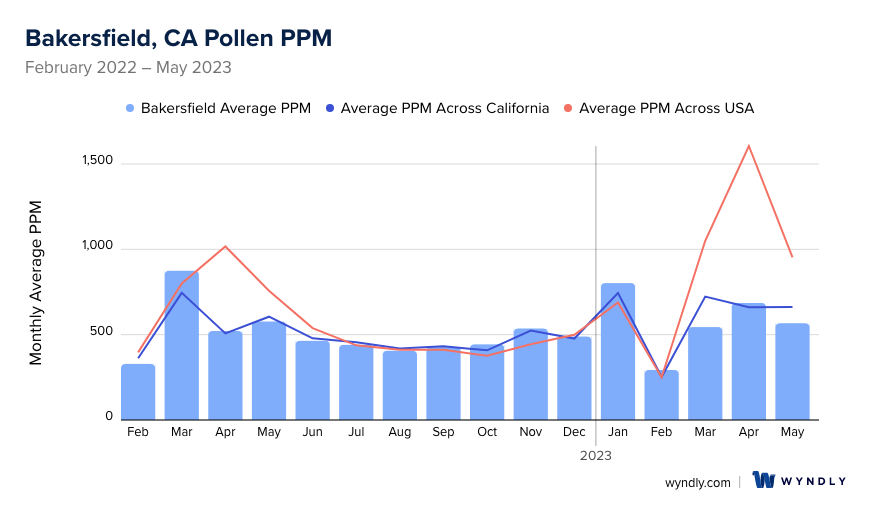
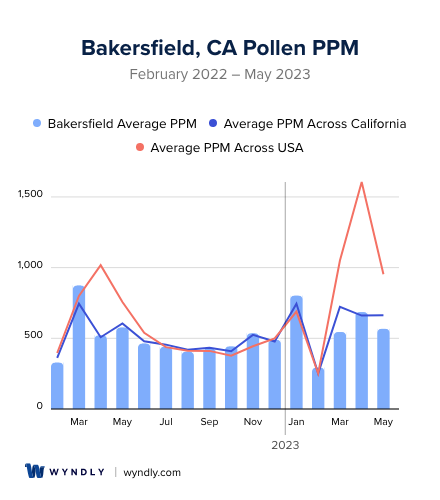
How does pollen in Bakersfield, CA compare to California?
Bakersfield has a lower average PPM than the state of California.
Bakersfield yearly avg PPM:
California yearly avg PPM:
How does pollen in Bakersfield, CA compare to the USA?
Bakersfield has a lower average PPM than the USA.
Bakersfield yearly avg PPM:
USA yearly avg PPM:
Is pollen worse this year in Bakersfield, CA?
Spring 2023 was better than spring 2022.
Spring 2023 PPM:
Spring 2022 PPM:
Average PPM in Bakersfield, CA
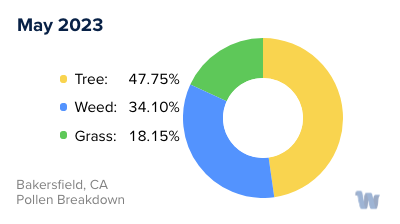
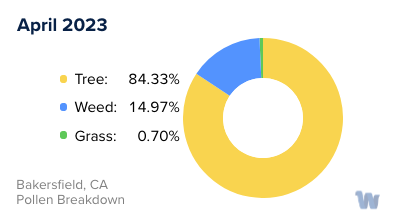
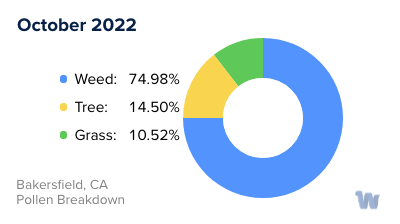
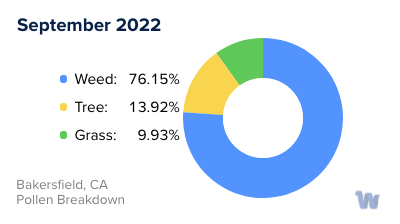
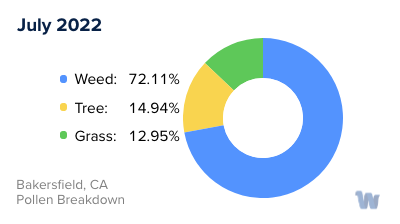
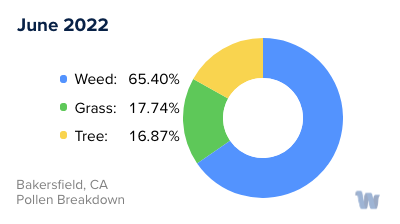
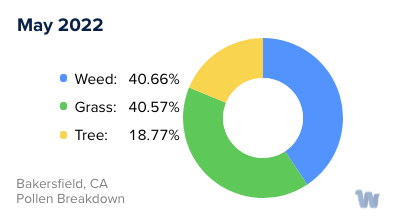
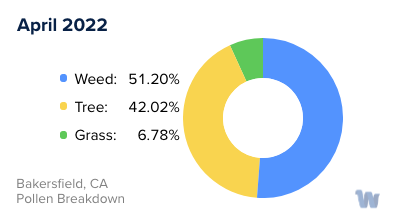
Bakersfield, CA Pollen and Allergy Breakdown by Month
Grass
When is grass pollen highest in Bakersfield, CA?
May has the highest grass pollen in Bakersfield, CA with an average PPM of
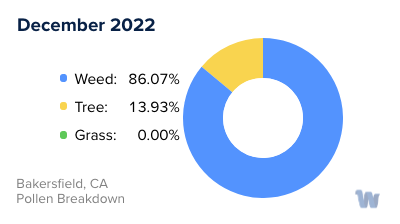
When is grass pollen lowest in Bakersfield, CA?
December has the lowest grass pollen in Bakersfield, CA with an average PPM of
Tree
When is tree pollen highest in Bakersfield, CA?
March has the highest tree pollen in Bakersfield, CA with an average PPM of
When is tree pollen lowest in Bakersfield, CA?
August has the lowest tree pollen in Bakersfield, CA with an average PPM of
Weed
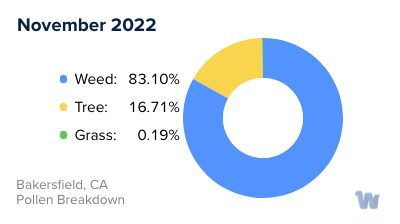
When is weed pollen highest in Bakersfield, CA?
November has the highest weed pollen in Bakersfield, CA with an average PPM of
When is weed pollen lowest in Bakersfield, CA?
February has the lowest weed pollen in Bakersfield, CA with an average PPM of
Bakersfield, CA Pollen Monthly Breakdown by Pollen Type


Pollen and Hay Fever in Bakersfield, CA
Living in Bakersfield, California, there's a good chance you've experienced the sneezing, itchy eyes, and general discomfort that comes with pollen allergies, particularly during certain times of the year. These allergies, often referred to as hay fever, are caused by a reaction to pollen from trees, grasses, and weeds that are prevalent in the area.
In Bakersfield, the density of pollen in the air varies, but measurements can reach up to 27 grains per cubic meter of air. It's important to note that the overall pollen count encompasses all types of pollen, which means that even when the overall pollen count is low, the levels of a specific type of pollen could still be high. This might lead to elevated allergy risk for individuals sensitive to that particular type of pollen.
Let's take a closer look at the main culprits. Tree pollen, grass pollen, and ragweed pollen are the most common types causing allergies in Bakersfield. Tree pollen levels fluctuate, but there are periods when the count can be relatively low. On the other hand, grass pollen can pose a substantial problem. While it can also be low at times, there are periods when the grass pollen count skyrockets to very high levels, making it a significant concern for those with allergies.
Lastly, there's ragweed pollen. Although ragweed is a common cause of allergies in many parts of the United States, in Bakersfield the levels tend to be quite low or even nonexistent during certain periods. This is good news for those who are particularly sensitive to ragweed.
In summary, if you're in Bakersfield and find yourself sniffling more than usual, it could well be due to the pollen from trees, grasses, or ragweed. It's worth keeping track of local pollen counts, especially during the seasons when these plants are producing and releasing their pollen into the air. This understanding could be key in managing your comfort levels and planning your outdoor activities.