Chandler, AZ Pollen and Allergy Report for Summer 2023

Pollen Allergy Trends in Chandler, AZ
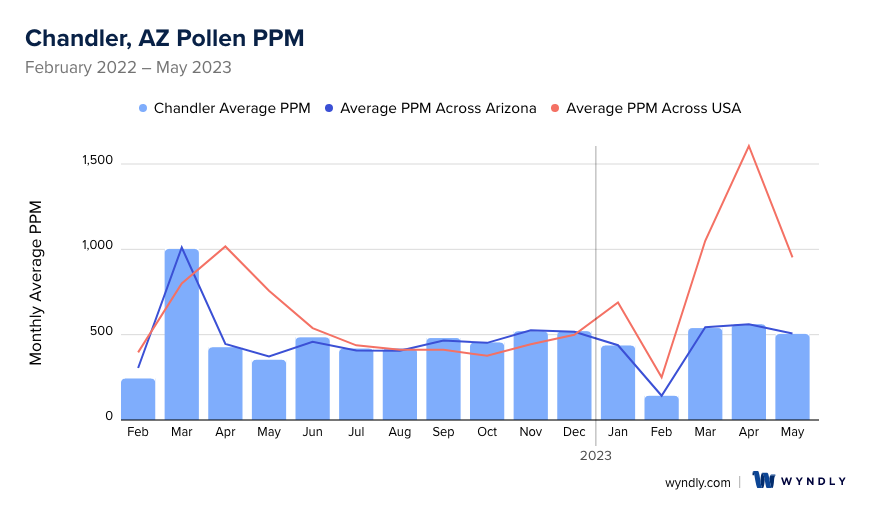
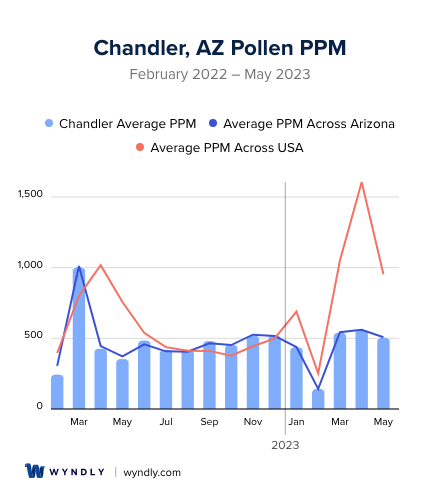
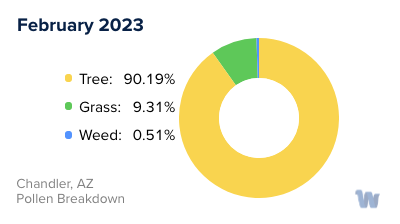
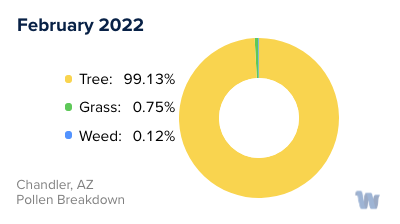
When is pollen lowest in Chandler, AZ?
February
Lowest month total PPM
Avg. PPM
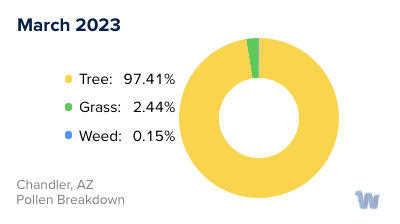
When is pollen highest in Chandler, AZ?
March
Highest month total PPM
Avg. PPM
How does pollen in Chandler, AZ compare to Arizona?
Chandler has a lower average PPM than the state of Arizona.
Chandler yearly avg PPM:
Arizona yearly avg PPM:
How does pollen in Chandler, AZ compare to the USA?
Chandler has a lower average PPM than the USA.
Chandler yearly avg PPM:
USA yearly avg PPM:
Is pollen worse this year in Chandler, AZ?
Spring 2023 was better than spring 2022.
Spring 2023 PPM:
Spring 2022 PPM:
Average PPM in Chandler, AZ
Chandler, AZ Pollen and Allergy Breakdown by Month
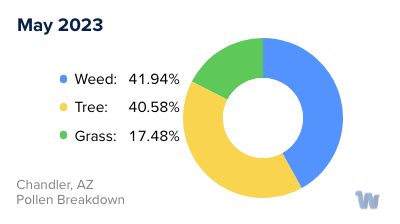
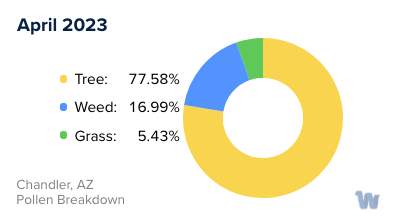
Grass
When is grass pollen highest in Chandler, AZ?
August has the highest grass pollen in Chandler, AZ with an average PPM of
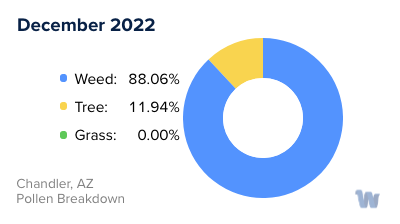
When is grass pollen lowest in Chandler, AZ?
December has the lowest grass pollen in Chandler, AZ with an average PPM of
Tree
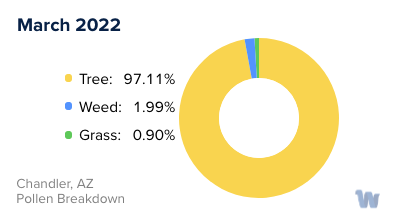
When is tree pollen highest in Chandler, AZ?
March has the highest tree pollen in Chandler, AZ with an average PPM of
When is tree pollen lowest in Chandler, AZ?
July has the lowest tree pollen in Chandler, AZ with an average PPM of
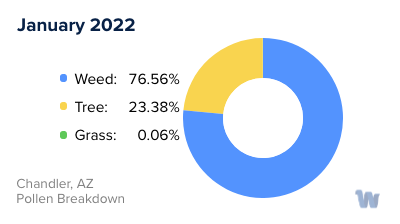
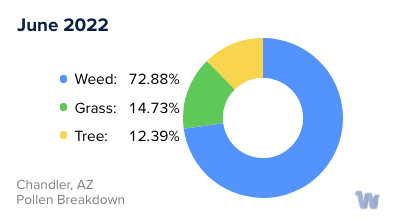
Weed
When is weed pollen highest in Chandler, AZ?
December has the highest weed pollen in Chandler, AZ with an average PPM of
When is weed pollen lowest in Chandler, AZ?
February has the lowest weed pollen in Chandler, AZ with an average PPM of
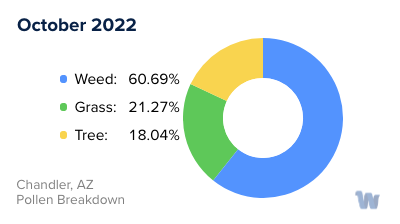
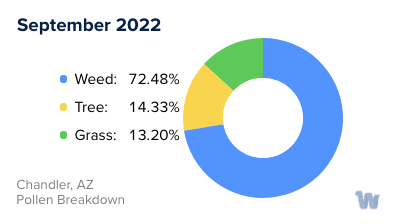
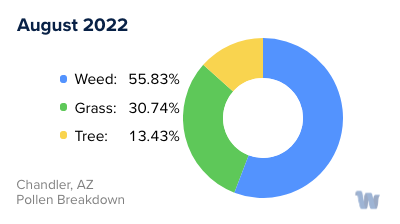
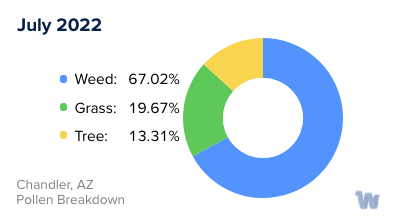
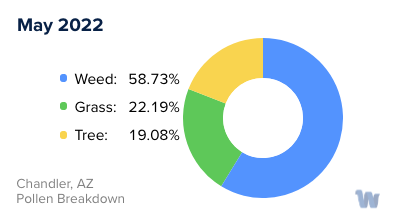
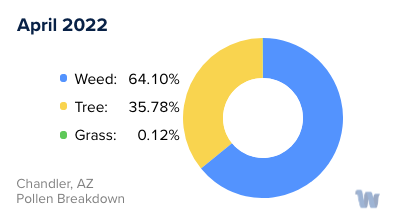
Chandler, AZ Pollen Monthly Breakdown by Pollen Type

Pollen and Hay Fever in Chandler, AZ
In Chandler, Arizona, the warm and dry climate provides an environment conducive for a variety of pollen to thrive, potentially triggering symptoms of hay fever and pollen allergies among sensitive individuals.
One of the primary sources of pollen in Chandler is grass, which is known to produce high amounts of pollen, particularly during the summer months. This means that individuals who are allergic to grass pollen might experience heightened symptoms during this season. Another significant pollen source is ragweed, a type of weed that produces pollen primarily in the fall but can continue to do so into the winter.
Trees are also key contributors to the pollen count in Chandler. Unlike grass and ragweed, trees in Arizona release their pollen in both the winter and spring. This distribution across different seasons means that individuals with tree pollen allergies could experience symptoms at multiple times throughout the year.
It's important to note that the overall pollen count isn't just a simple addition of these different sources. For example, even when the overall pollen count is low, a specific type of pollen such as grass or ragweed could still be high, potentially triggering symptoms in individuals who are particularly sensitive to those types.
Pollen allergies are primarily prevalent in the spring, summer, and fall in Arizona. However, due to the state's dry and warm climate, pollen allergies can persist throughout the winter as well. Typically, the months of April, May, and September are when seasonal allergies peak in Chandler.
In conclusion, the types of pollen and their corresponding seasons vary in Chandler, Arizona, making it essential for individuals with pollen allergies to stay informed and be prepared. Despite the challenges, understanding these patterns can help those affected navigate through each season with greater ease and comfort.