Kent, WA Pollen and Allergy Report for Summer 2023

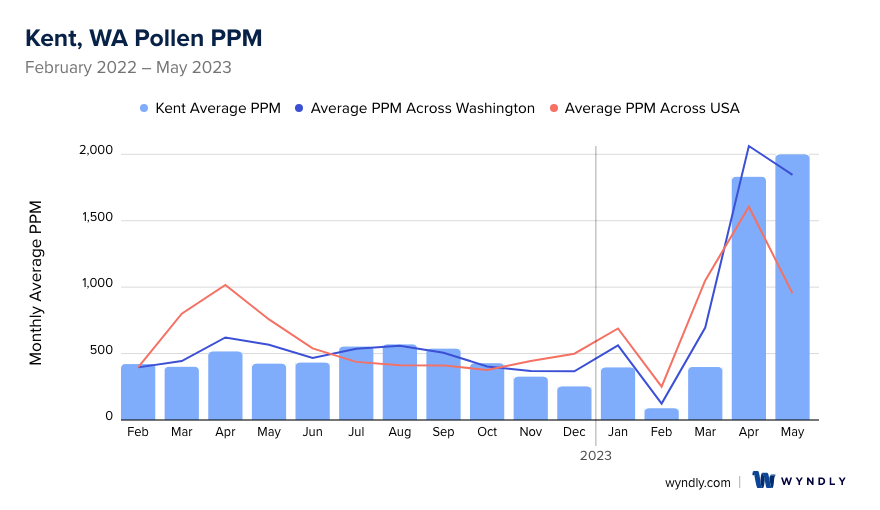
Pollen Allergy Trends in Kent, WA
When is pollen lowest in Kent, WA?
February
Lowest month total PPM
Avg. PPM
When is pollen highest in Kent, WA?
May
Highest month total PPM
Avg. PPM
How does pollen in Kent, WA compare to Washington?
Kent has a lower average PPM than the state of Washington.
Kent yearly avg PPM:
Washington yearly avg PPM:
How does pollen in Kent, WA compare to the USA?
Kent has a lower average PPM than the USA.
Kent yearly avg PPM:
USA yearly avg PPM:
Is pollen worse this year in Kent, WA?
Spring 2023 was worse than spring 2022.
Spring 2023 PPM:
Spring 2022 PPM:
Average PPM in Kent, WA
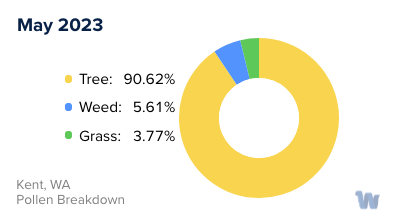
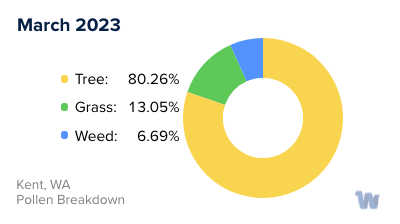
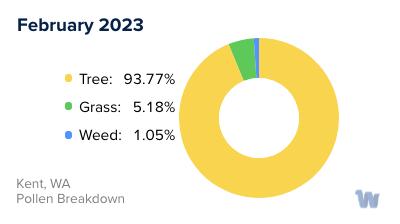
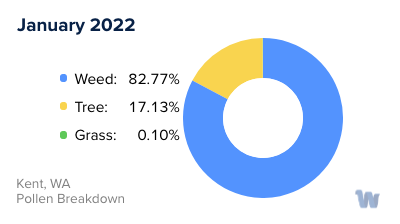
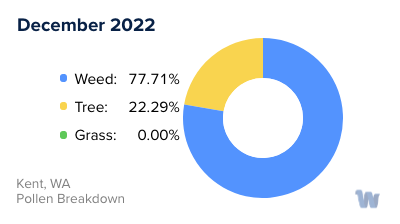
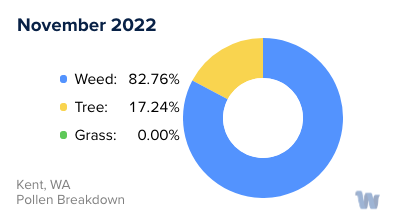
Kent, WA Pollen and Allergy Breakdown by Month
Grass
When is grass pollen highest in Kent, WA?
March has the highest grass pollen in Kent, WA with an average PPM of
When is grass pollen lowest in Kent, WA?
November has the lowest grass pollen in Kent, WA with an average PPM of
Tree
When is tree pollen highest in Kent, WA?
May has the highest tree pollen in Kent, WA with an average PPM of
When is tree pollen lowest in Kent, WA?
April has the lowest tree pollen in Kent, WA with an average PPM of
Weed
When is weed pollen highest in Kent, WA?
August has the highest weed pollen in Kent, WA with an average PPM of
When is weed pollen lowest in Kent, WA?
February has the lowest weed pollen in Kent, WA with an average PPM of
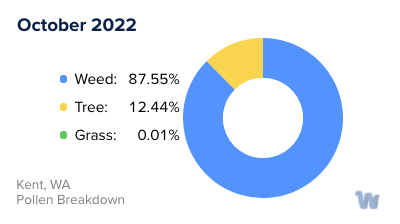
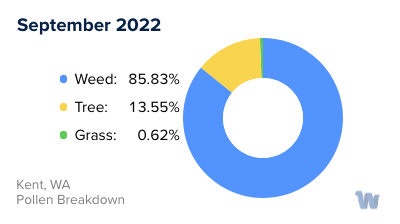
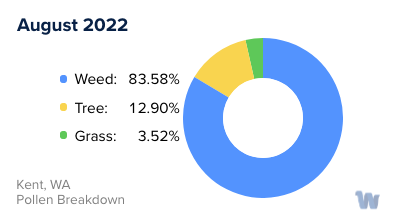
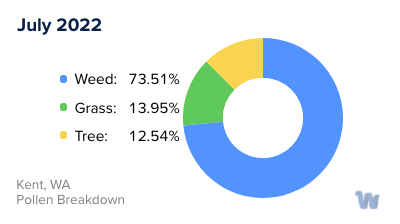
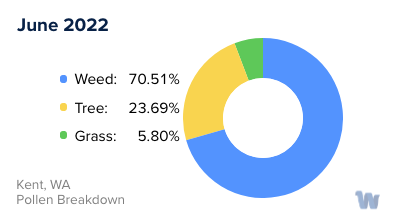
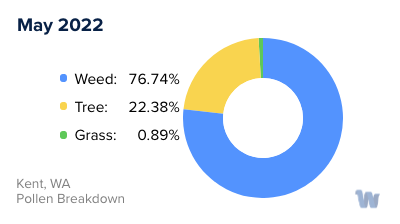
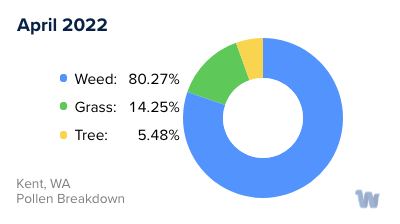
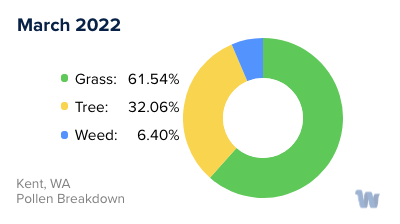
Kent, WA Pollen Monthly Breakdown by Pollen Type

Pollen and Hay Fever in Kent, WA
Pollen allergies, also known as hay fever, are a common concern for many residents of Kent, Washington. While the city's lush greenery and diverse flora are indeed beautiful, they can cause discomfort for individuals susceptible to hay fever.
There are three main types of pollen that can trigger allergies: tree, grass, and weed. Each of these types has its peak season, which can vary slightly depending on the weather conditions each year.
Tree pollen is usually the first to appear, often starting as early as February and continuing until June. The most common trees that contribute to pollen allergies in Kent are oaks, maples, and pines. Their pollen is lightweight and can travel long distances in the wind, leading to widespread exposure.
Following the tree pollen season, grass pollen takes the stage. The peak season for grass pollen allergies typically falls between May and early July. The primary culprits in Kent are ryegrass and Timothy grass, both of which produce high amounts of pollen that can cause allergic reactions.
Weed pollen emerges in late summer and can linger until the first frost in autumn. The most common weeds producing allergenic pollen in Kent are ragweed, plantain, and nettle. Ragweed is especially notable because a single plant can produce up to a billion pollen grains in a season.
It's important to remember that while these periods represent the peak seasons for each pollen type, low levels of each can be present at other times of the year as well. Variations in weather, such as a particularly warm winter or rainy spring, can also affect pollen levels.
In Kent, as in many other parts of the country, pollen counts tend to be highest on warm, dry, and windy days, and lowest immediately after a rainstorm when the pollen has been washed from the air.
Understanding the pollen seasons in Kent can help residents anticipate and prepare for periods of increased allergies. While it may not always be possible to avoid exposure, awareness of the pollen calendar can be a helpful tool in managing the impact of pollen allergies on daily life.