Louisville, KY Pollen and Allergy Report for Summer 2023

Pollen Allergy Trends in Louisville, KY
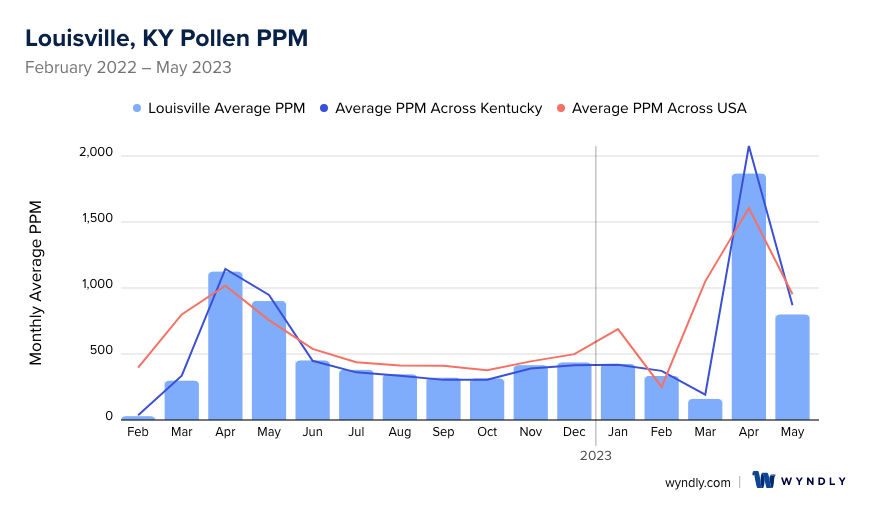
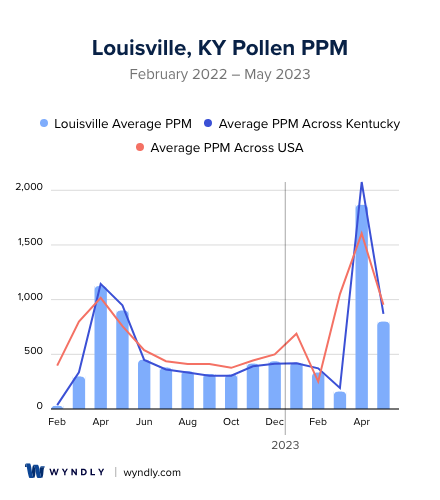
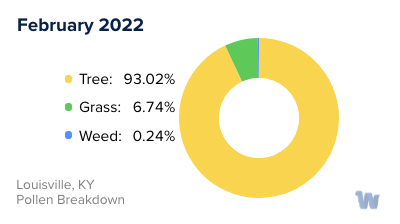
When is pollen lowest in Louisville, KY?
February
Lowest month total PPM
Avg. PPM
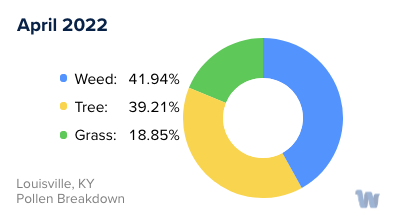
When is pollen highest in Louisville, KY?
April
Highest month total PPM
Avg. PPM
How does pollen in Louisville, KY compare to Kentucky?
Louisville has a lower average PPM than the state of Kentucky.
Louisville yearly avg PPM:
Kentucky yearly avg PPM:
How does pollen in Louisville, KY compare to the USA?
Louisville has a lower average PPM than the USA.
Louisville yearly avg PPM:
USA yearly avg PPM:
Is pollen worse this year in Louisville, KY?
Spring 2023 was worse than spring 2022.
Spring 2023 PPM:
Spring 2022 PPM:
Average PPM in Louisville, KY
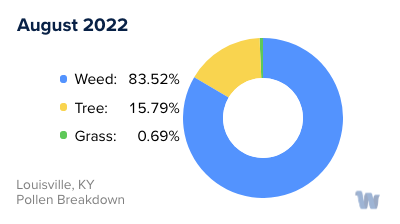
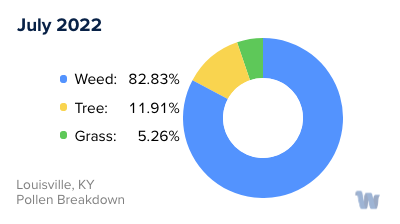
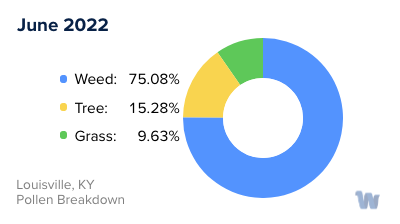
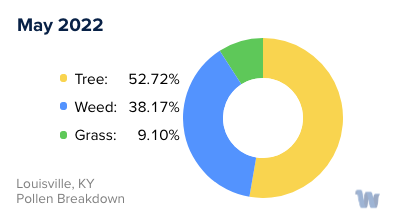
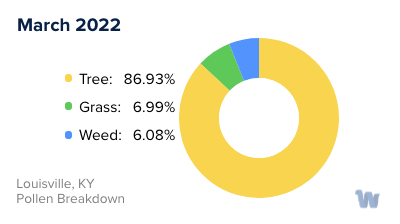
Louisville, KY Pollen and Allergy Breakdown by Month
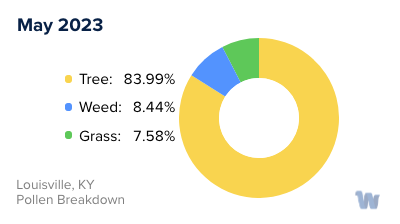
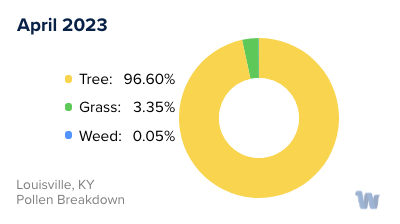
Grass
When is grass pollen highest in Louisville, KY?
April has the highest grass pollen in Louisville, KY with an average PPM of
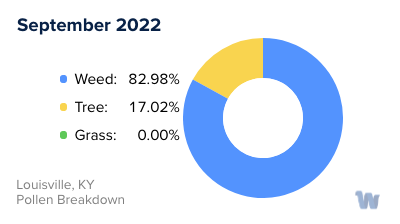
When is grass pollen lowest in Louisville, KY?
September has the lowest grass pollen in Louisville, KY with an average PPM of
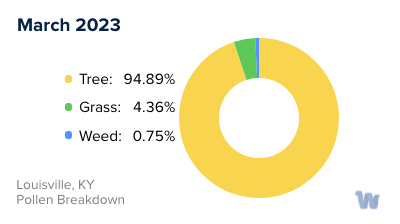
Tree
When is tree pollen highest in Louisville, KY?
April has the highest tree pollen in Louisville, KY with an average PPM of
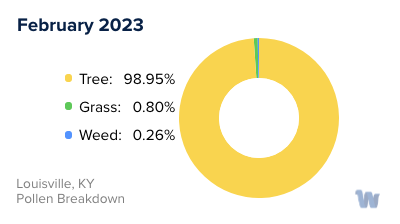
When is tree pollen lowest in Louisville, KY?
February has the lowest tree pollen in Louisville, KY with an average PPM of
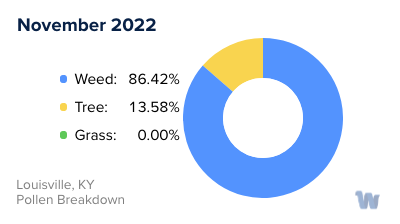
Weed
When is weed pollen highest in Louisville, KY?
April has the highest weed pollen in Louisville, KY with an average PPM of
When is weed pollen lowest in Louisville, KY?
February has the lowest weed pollen in Louisville, KY with an average PPM of
Louisville, KY Pollen Monthly Breakdown by Pollen Type


Pollen and Hay Fever in Louisville, KY
Pollen allergies, commonly known as hay fever, are quite prevalent in Louisville, Kentucky, and can significantly affect the quality of life for residents during certain seasons.
The city, renowned for its verdant landscapes and diverse range of flora, hosts a variety of plants that produce pollen. This microscopic substance, although integral for plant reproduction, can often trigger allergic reactions in individuals sensitive to it. While invisible to the naked eye, these minute particles can cause a series of discomforting symptoms such as sneezing, nasal congestion, and itchy eyes.
In Louisville, the primary types of pollen that cause allergies come from trees, grasses, and weeds. Each plant type releases pollen into the air at different times of the year, leading to a more extended allergy season.
Tree pollen is generally the first to appear each year, making its debut in late winter and early spring. Common culprits in Louisville include oak, maple, cedar, and pine. These trees produce large amounts of lightweight pollen that can easily be carried by the wind, potentially causing allergic reactions in susceptible individuals.
As spring transitions into summer, grass pollen takes center stage. In Louisville, the main sources of grass pollen are from species such as Kentucky bluegrass, ryegrass, and fescue. These grasses typically pollinate from late spring to early summer, causing allergy symptoms in many residents.
By the time fall rolls around, weed pollen becomes the primary allergen. Ragweed, a prevalent plant in Louisville, begins releasing pollen in late summer and continues through the fall. This plant is a significant cause of hay fever due to its high pollen production and the ability of the pollen to travel long distances.
In conclusion, Louisville's diverse flora leads to a lengthy pollen season, starting with tree pollen in the early spring, transitioning to grass pollen in the summer, and ending with weed pollen in the fall. Understanding the types of pollen and their respective seasons can help residents better anticipate and manage their allergy symptoms.