New York, NY Pollen and Allergy Report for Summer 2023

Pollen Allergy Trends in New York, NY
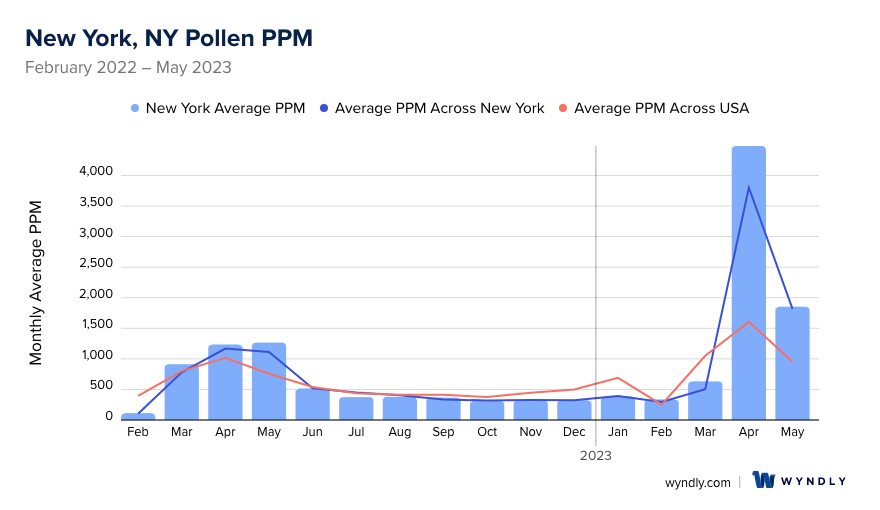
When is pollen lowest in New York, NY?
February
Lowest month total PPM
Avg. PPM
When is pollen highest in New York, NY?
April
Highest month total PPM
Avg. PPM
How does pollen in New York, NY compare to New York?
New York has a higher average PPM than the state of New York.
New York yearly avg PPM:
New York yearly avg PPM:
How does pollen in New York, NY compare to the USA?
New York has a higher average PPM than the USA.
New York yearly avg PPM:
USA yearly avg PPM:
Is pollen worse this year in New York, NY?
Spring 2023 was worse than spring 2022.
Spring 2023 PPM:
Spring 2022 PPM:
Average PPM in New York, NY
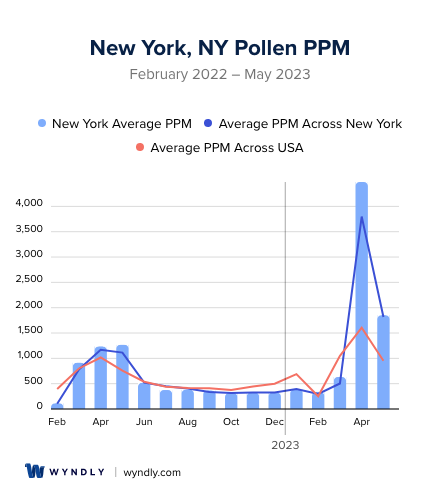
New York, NY Pollen and Allergy Breakdown by Month
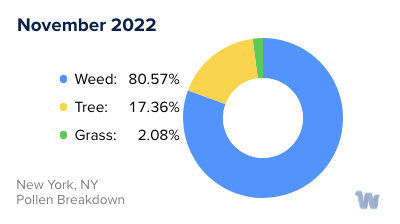
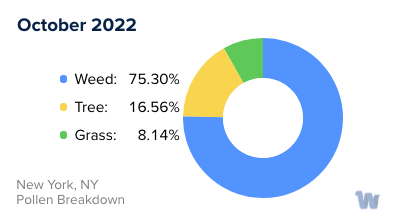
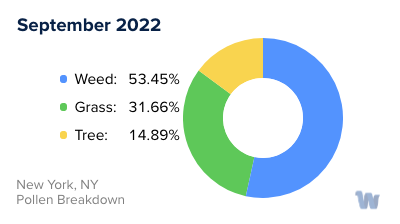
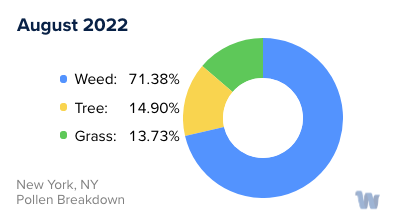
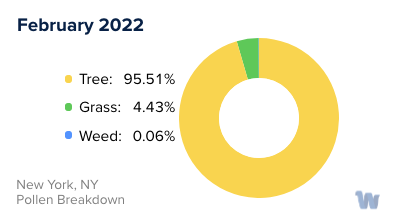
Grass
When is grass pollen highest in New York, NY?
April has the highest grass pollen in New York, NY with an average PPM of
When is grass pollen lowest in New York, NY?
December has the lowest grass pollen in New York, NY with an average PPM of
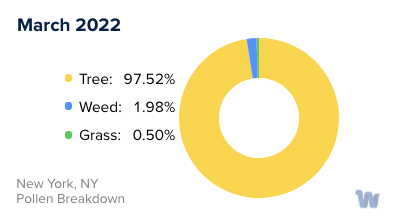
Tree
When is tree pollen highest in New York, NY?
April has the highest tree pollen in New York, NY with an average PPM of
When is tree pollen lowest in New York, NY?
January has the lowest tree pollen in New York, NY with an average PPM of
Weed
When is weed pollen highest in New York, NY?
April has the highest weed pollen in New York, NY with an average PPM of
When is weed pollen lowest in New York, NY?
February has the lowest weed pollen in New York, NY with an average PPM of
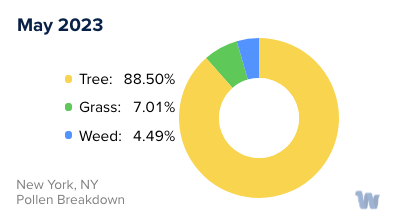
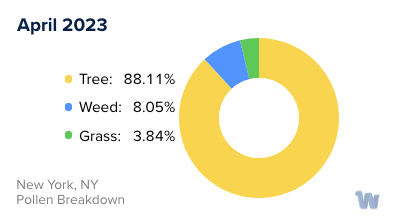
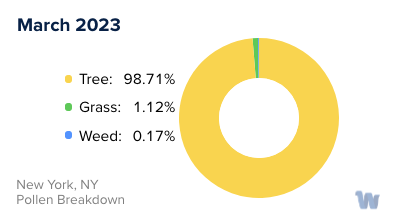
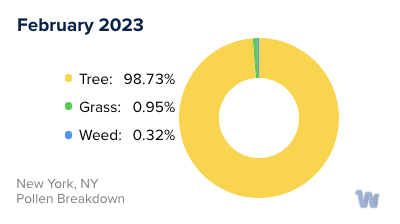
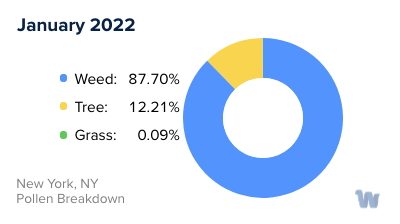
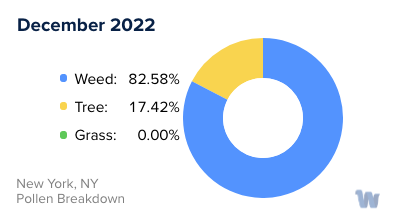
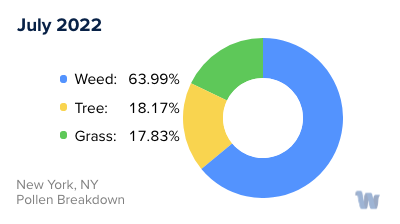
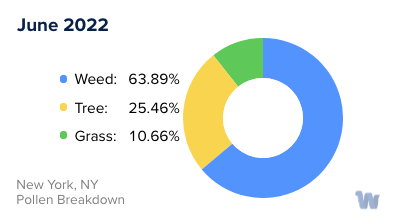
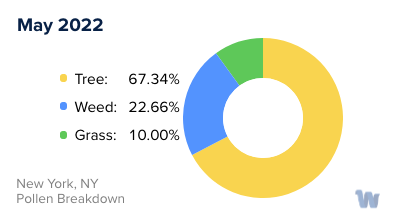
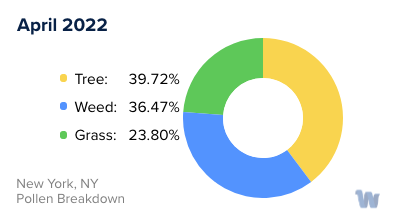
New York, NY Pollen Monthly Breakdown by Pollen Type
Pollen and Hay Fever in New York, NY
For those residing in New York City, pollen allergies and hay fever can be a significant part of the changing seasons. Known formally as seasonal allergic rhinitis, these conditions are typically triggered by various types of pollen that the city's diverse flora releases throughout the year.
One of the primary culprits of seasonal allergies in the Big Apple is tree pollen. As spring sets in, trees such as oak, maple, and birch begin to bloom, releasing substantial amounts of pollen into the air. These types of pollen are very light and can be carried by the wind for miles, making their impact felt across the city.
As the city transitions from spring to summer, grass pollen takes the baton. The lawns and parks, which are home to species like Kentucky bluegrass, perennial ryegrass, and Timothy grass, can be a significant source of allergens during the warmer months. The grasses release pollen when they flower, usually in the early mornings, leading to an increase in allergy symptoms among sensitive individuals.
Lastly, as fall approaches, weed pollen, most notably ragweed, becomes the main allergen. Despite being less common in the urban jungle of New York City, ragweed pollen is highly allergenic and can travel great distances, affecting city dwellers even if the plants themselves aren't present in their immediate environment.
In between these seasons, a small respite may be found during the colder winter months when pollen counts typically drop. However, indoor allergens like dust mites and pet dander can still trigger allergic reactions.
So, whether you're enjoying a stroll in Central Park, walking the busy streets, or savoring the view of the skyline from your apartment, it's essential to remember that New York City's dynamic ecosystem can influence your experience of allergies and hay fever throughout the year. The city's vast array of trees, grasses, and weeds each have their season, playing a role in the symphony of allergens that compose New York City's unique pollen calendar.