Norwalk, CA Pollen and Allergy Report for Summer 2023

Pollen Allergy Trends in Norwalk, CA
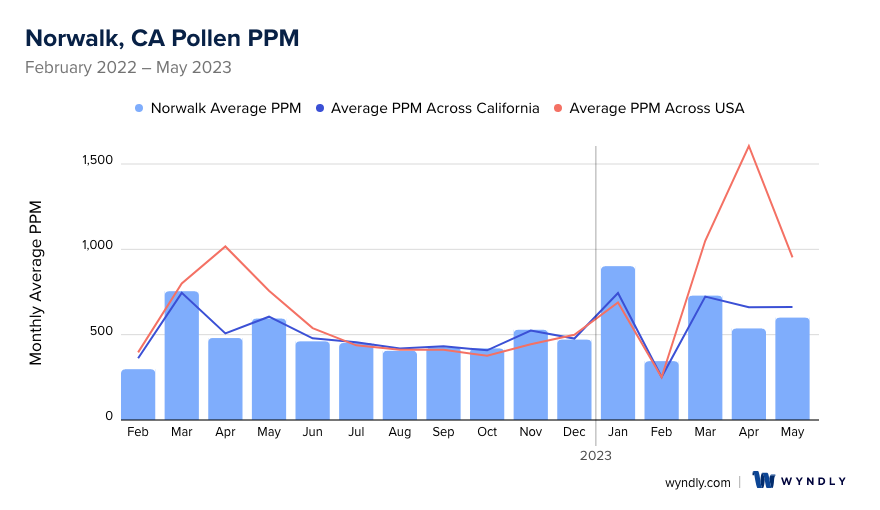
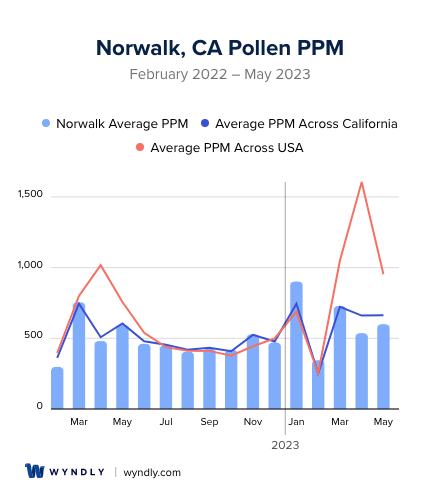
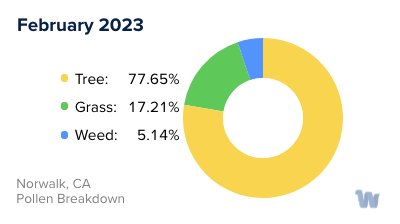
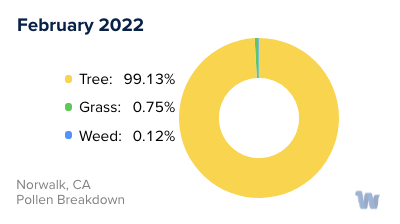
When is pollen lowest in Norwalk, CA?
February
Lowest month total PPM
Avg. PPM
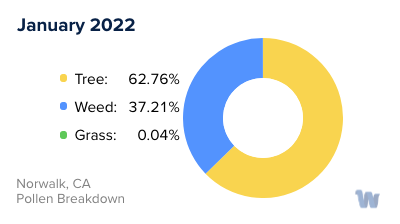
When is pollen highest in Norwalk, CA?
January
Highest month total PPM
Avg. PPM
How does pollen in Norwalk, CA compare to California?
Norwalk has a lower average PPM than the state of California.
Norwalk yearly avg PPM:
California yearly avg PPM:
How does pollen in Norwalk, CA compare to the USA?
Norwalk has a lower average PPM than the USA.
Norwalk yearly avg PPM:
USA yearly avg PPM:
Is pollen worse this year in Norwalk, CA?
Spring 2023 was about the same as 2022.
Spring 2023 PPM:
Spring 2022 PPM:
Average PPM in Norwalk, CA
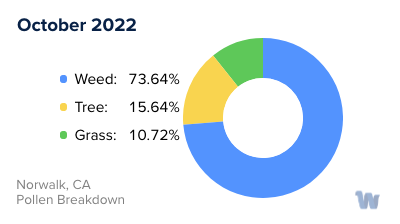
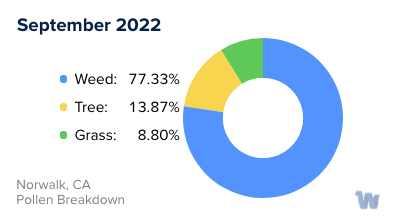
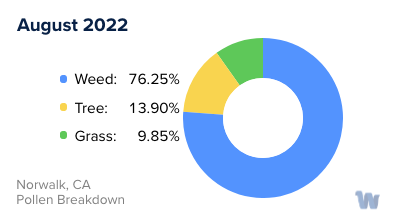
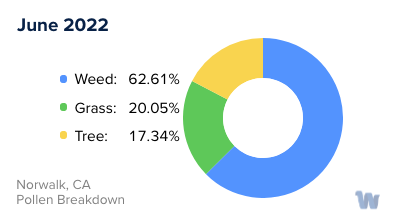
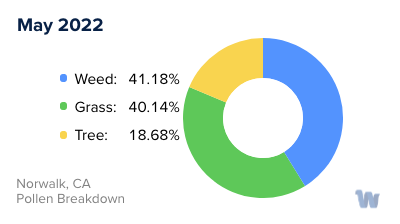
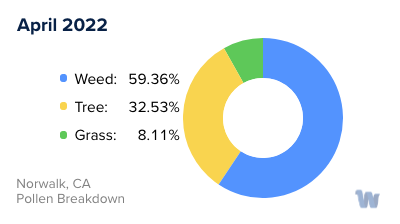
Norwalk, CA Pollen and Allergy Breakdown by Month
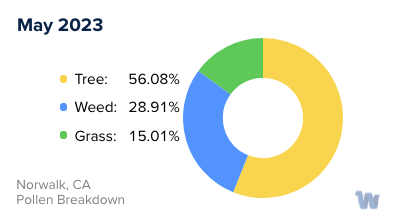
Grass
When is grass pollen highest in Norwalk, CA?
May has the highest grass pollen in Norwalk, CA with an average PPM of
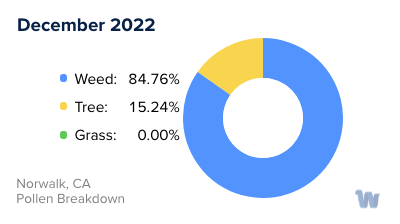
When is grass pollen lowest in Norwalk, CA?
December has the lowest grass pollen in Norwalk, CA with an average PPM of
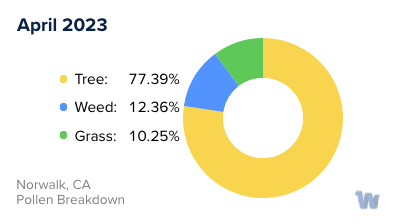
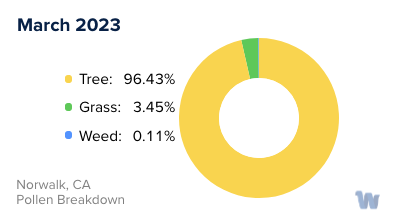
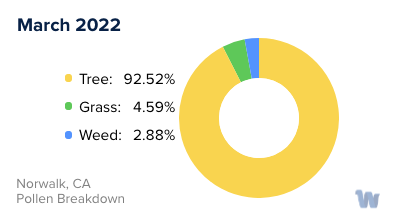
Tree
When is tree pollen highest in Norwalk, CA?
March has the highest tree pollen in Norwalk, CA with an average PPM of
When is tree pollen lowest in Norwalk, CA?
August has the lowest tree pollen in Norwalk, CA with an average PPM of
Weed
When is weed pollen highest in Norwalk, CA?
November has the highest weed pollen in Norwalk, CA with an average PPM of
When is weed pollen lowest in Norwalk, CA?
February has the lowest weed pollen in Norwalk, CA with an average PPM of
Norwalk, CA Pollen Monthly Breakdown by Pollen Type


Pollen and Hay Fever in Norwalk, CA
When spring blooms in Norwalk, California, its lush beauty is accompanied by a less than pleasant side effect for some residents: pollen allergies. These allergies, often referred to as hay fever, manifest when our immune system overreacts to pollen, treating these harmless particles as if they were harmful intruders.
Pollen, an airborne substance, is released by various plants in the process of fertilization. In Norwalk, there are several types of pollen that can trigger allergies. The chief culprits are trees, grasses, and weeds.
Tree pollen is usually the first to appear in the year, often becoming noticeable as early as February. Oak, cedar, pine, and walnut trees are common in Norwalk, and their pollen can become a significant allergen for susceptible individuals. This tree pollen season usually continues until May, marking the start of spring for many.
Following the tree pollen season, grass pollen takes the stage in late spring and early summer. Bermuda grass, ryegrass, and Kentucky bluegrass, common grasses in this area, produce a significant amount of pollen, and can cause an uptick in allergy symptoms. The grass pollen season typically lasts until July.
Finally, weed pollen tends to make its debut in the late summer and continues into the fall. In Norwalk, ragweed is a common source of pollen allergies, but other weeds such as sagebrush and pigweed can also contribute to the pollen count.
The severity and duration of each pollen season can vary year by year, depending largely on weather conditions. Rainfall, for example, can wash pollen out of the air, providing temporary relief, but can also promote plant growth and subsequent pollen production.
Understanding the types of pollen and their seasons can help those with allergies anticipate and navigate their symptoms. By being aware of the pollen forecast and taking preventative measures, people living in Norwalk can still enjoy the beautiful outdoors, regardless of the season.