Hesperia, CA Pollen and Allergy Report for Summer 2023

Pollen Allergy Trends in Hesperia, CA
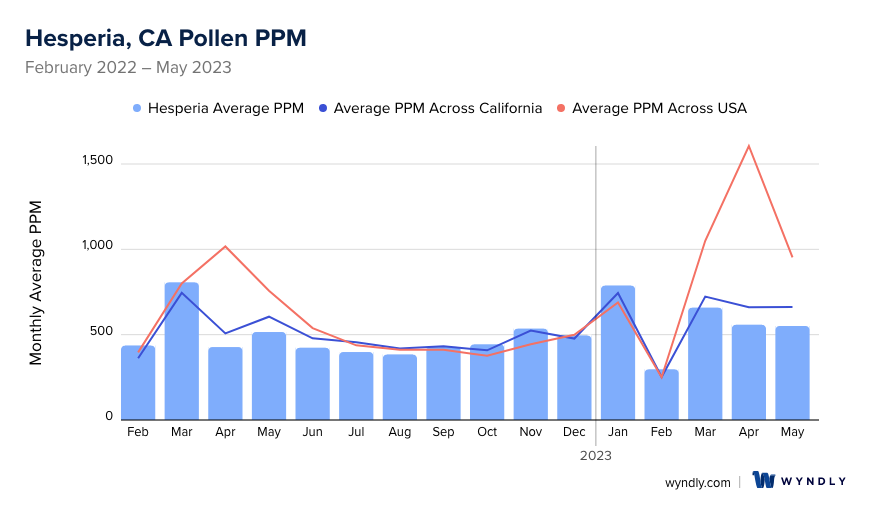
When is pollen lowest in Hesperia, CA?
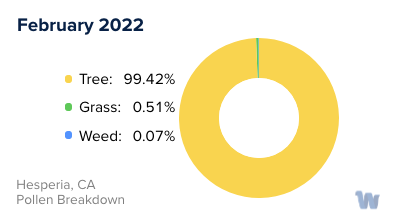
February
Lowest month total PPM
Avg. PPM
When is pollen highest in Hesperia, CA?
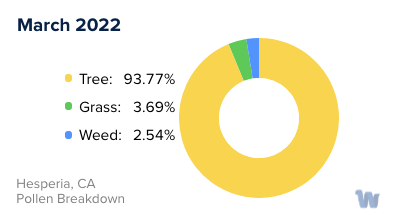
March
Highest month total PPM
Avg. PPM
How does pollen in Hesperia, CA compare to California?
Hesperia has a lower average PPM than the state of California.
Hesperia yearly avg PPM:
California yearly avg PPM:
How does pollen in Hesperia, CA compare to the USA?
Hesperia has a lower average PPM than the USA.
Hesperia yearly avg PPM:
USA yearly avg PPM:
Is pollen worse this year in Hesperia, CA?
Spring 2023 was about the same as 2022.
Spring 2023 PPM:
Spring 2022 PPM:
Average PPM in Hesperia, CA
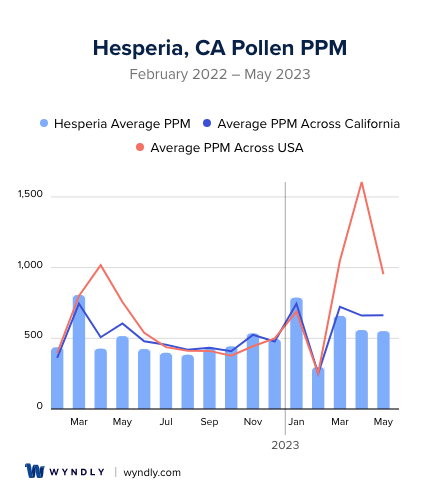
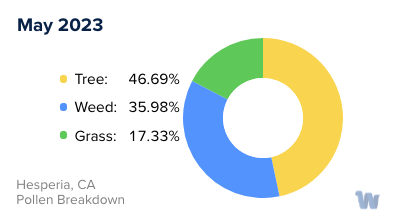
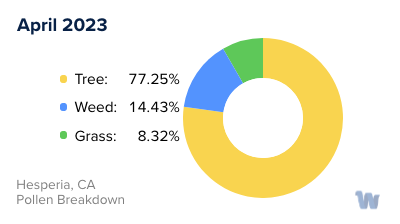
Hesperia, CA Pollen and Allergy Breakdown by Month
Grass
When is grass pollen highest in Hesperia, CA?
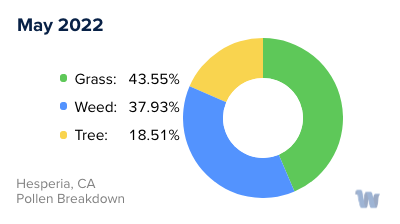
May has the highest grass pollen in Hesperia, CA with an average PPM of
When is grass pollen lowest in Hesperia, CA?
December has the lowest grass pollen in Hesperia, CA with an average PPM of
Tree
When is tree pollen highest in Hesperia, CA?
March has the highest tree pollen in Hesperia, CA with an average PPM of
When is tree pollen lowest in Hesperia, CA?
July has the lowest tree pollen in Hesperia, CA with an average PPM of
Weed
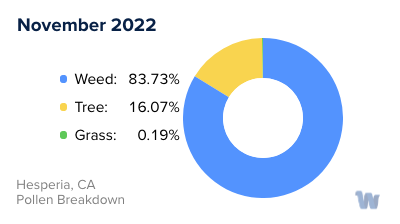
When is weed pollen highest in Hesperia, CA?
November has the highest weed pollen in Hesperia, CA with an average PPM of
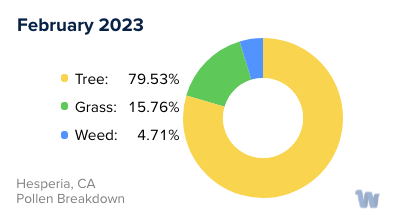
When is weed pollen lowest in Hesperia, CA?
February has the lowest weed pollen in Hesperia, CA with an average PPM of
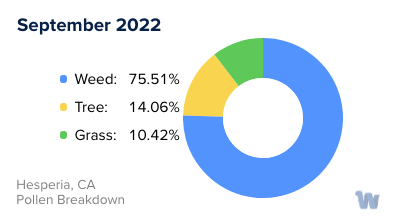
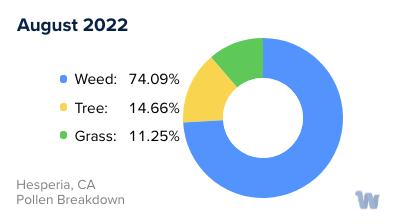
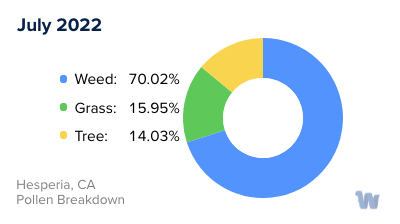
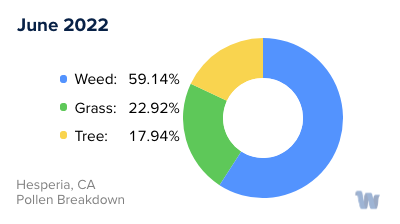
Hesperia, CA Pollen Monthly Breakdown by Pollen Type


Pollen and Hay Fever in Hesperia, CA
In Hesperia, California, residents enjoy a warm, coastal climate, but with it comes the challenge of pollen allergies, especially during specific seasons of the year. The primary offenders are grasses, trees, and weeds, each having their unique timeline and impact.
The most common pollens that people in Hesperia are allergic to include tree pollen, grass pollen, and ragweed pollen. Tree and ragweed pollen levels fluctuate, but they typically present in low amounts, with some days experiencing no tree or ragweed pollen at all. On the other hand, grass pollen can reach very high levels, potentially causing discomfort for those sensitive to it.
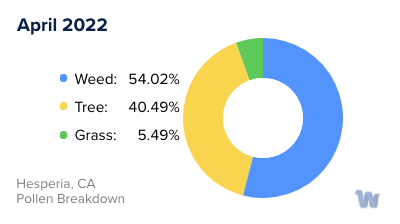
In terms of seasonality, California's allergy season generally starts in late January and continues until early October. Within this period, those sensitive to pollen might experience more symptoms during the spring, summer, and fall, with April, May, and September being particularly challenging months due to peak pollen counts.
The variety of plants in California means a diverse range of pollen sources, each blooming at different times. Trees that commonly produce pollen include Oak, Olive, Ash, Cedar, and Eucalyptus. Grasses like Bluegrass and Ryegrass, along with Ragweed and Russian thistle, are other significant contributors to pollen allergies.
Despite the long allergy season, California's climate can be somewhat forgiving for allergy sufferers. The coastal climate means lower pollen counts than in other states with similar weather conditions. This offers some relief, especially during the milder winter months, from late October or November when the seasonal allergy season usually ends.
In sum, understanding the types of pollen and their respective seasons can help Hesperia residents prepare and manage their symptoms better. Remember, pollen allergies are not year-round, and with knowledge comes the power to navigate the pollen seasons with ease.