Lansing, MI Pollen and Allergy Report for Summer 2023

Pollen Allergy Trends in Lansing, MI
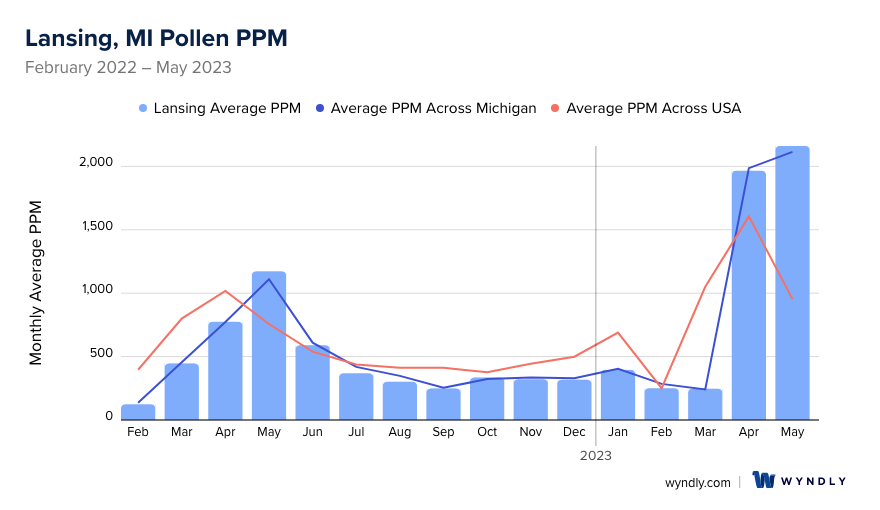
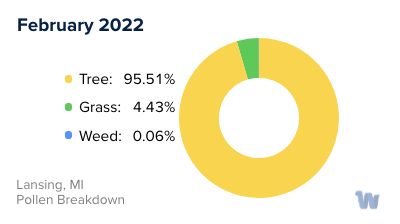
When is pollen lowest in Lansing, MI?
February
Lowest month total PPM
Avg. PPM
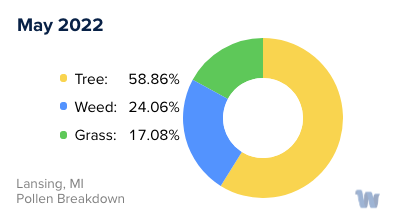
When is pollen highest in Lansing, MI?
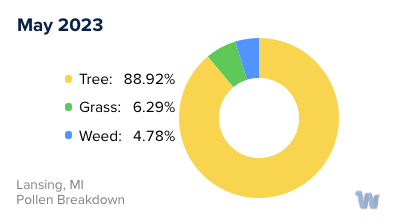
May
Highest month total PPM
Avg. PPM
How does pollen in Lansing, MI compare to Michigan?
Lansing has a lower average PPM than the state of Michigan.
Lansing yearly avg PPM:
Michigan yearly avg PPM:
How does pollen in Lansing, MI compare to the USA?
Lansing has a lower average PPM than the USA.
Lansing yearly avg PPM:
USA yearly avg PPM:
Is pollen worse this year in Lansing, MI?
Spring 2023 was worse than spring 2022.
Spring 2023 PPM:
Spring 2022 PPM:
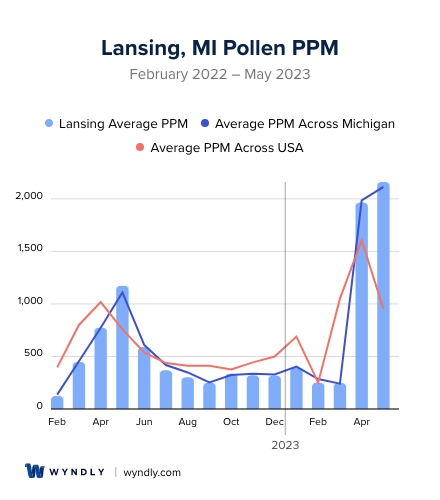
Average PPM in Lansing, MI
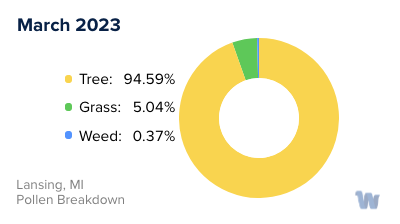
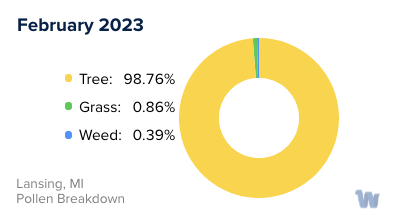
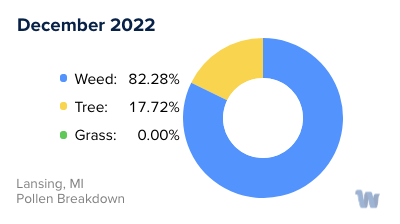
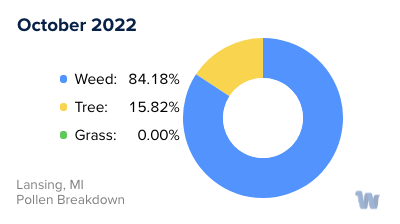
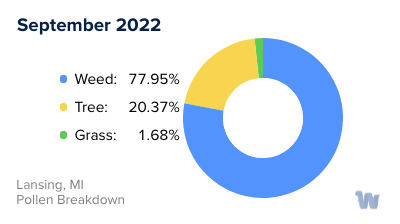
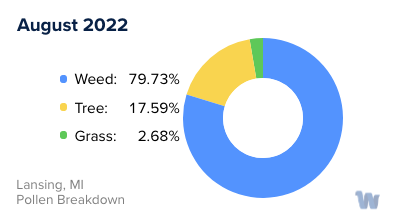
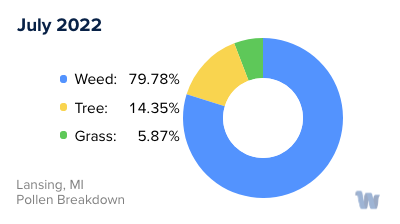
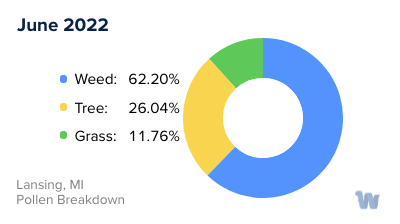
Lansing, MI Pollen and Allergy Breakdown by Month
Grass
When is grass pollen highest in Lansing, MI?
May has the highest grass pollen in Lansing, MI with an average PPM of
When is grass pollen lowest in Lansing, MI?
October has the lowest grass pollen in Lansing, MI with an average PPM of
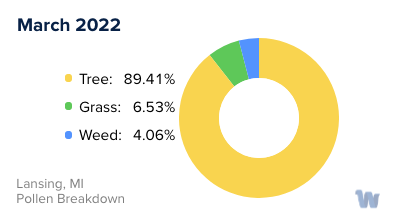
Tree
When is tree pollen highest in Lansing, MI?
May has the highest tree pollen in Lansing, MI with an average PPM of
When is tree pollen lowest in Lansing, MI?
September has the lowest tree pollen in Lansing, MI with an average PPM of
Weed
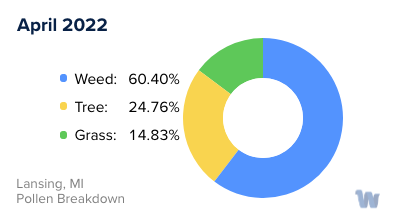
When is weed pollen highest in Lansing, MI?
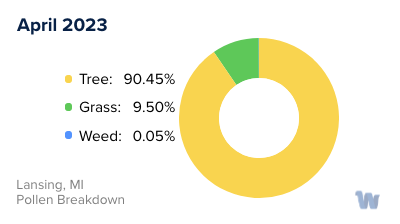
April has the highest weed pollen in Lansing, MI with an average PPM of
When is weed pollen lowest in Lansing, MI?
February has the lowest weed pollen in Lansing, MI with an average PPM of
Lansing, MI Pollen Monthly Breakdown by Pollen Type


Pollen and Hay Fever in Lansing, MI
For many residents of Lansing, Michigan, the arrival of certain seasons can be a mixed blessing. While the blossoming trees and blooming flowers are visually stunning, they often bring with them an unwelcome guest: pollen. This fine, powdery substance, released by plants for reproduction, is unfortunately a common trigger for allergies and hay fever.
In Lansing, the primary culprits for pollen allergies are trees, grasses, and weeds, each of which peak during different seasons.
Spring is typically tree pollen season. As the Michigan state capital starts to thaw from the winter cold, trees such as oak, maple, and birch begin to release their pollen. The light, dry nature of tree pollen allows it to be easily carried by the wind, sometimes for several miles, making it hard to avoid.
As we move into the summer, grass pollen takes the baton. Common grasses like ryegrass and timothy-grass begin to shed their pollen, a phenomenon that usually peaks in late June and early July. While less abundant than tree pollen, grass pollen is equally potent, causing discomfort for those with allergies.
Lastly, as summer gives way to fall, weed pollen steps into the spotlight. Ragweed, in particular, is the most significant source of weed pollen and is infamous for causing what's often referred to as 'fall allergies'. This hardy plant thrives in the temperate climate of Lansing and releases its pollen from late summer to the first frost, typically in October or November.
Though pollen allergies and hay fever can be a nuisance, understanding the types of pollen and their corresponding seasons can help you prepare and manage your symptoms better. Remember, pollen counts tend to be highest on warm, dry, breezy days and lowest after a heavy rainfall or on cool, windless days. By staying informed, you can better navigate the pollen seasons in Lansing and continue to enjoy the city's beautiful outdoors.