Billings, MT Pollen and Allergy Report for Summer 2023

Pollen Allergy Trends in Billings, MT
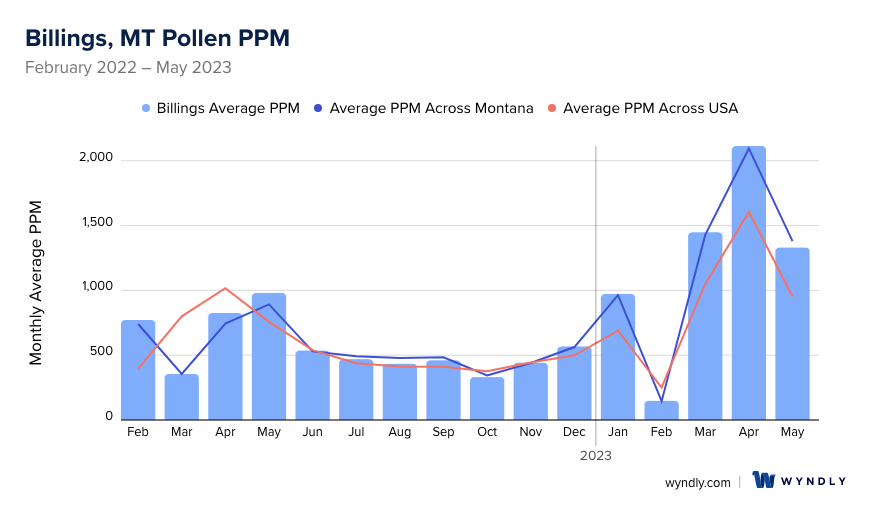
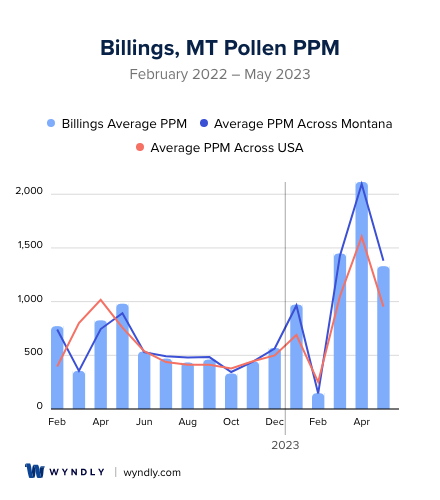
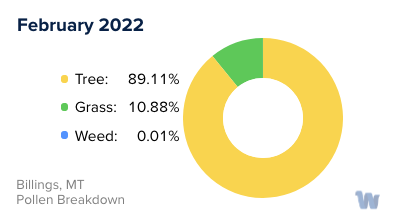
When is pollen lowest in Billings, MT?
February
Lowest month total PPM
Avg. PPM
When is pollen highest in Billings, MT?
April
Highest month total PPM
Avg. PPM
How does pollen in Billings, MT compare to Montana?
Billings has a higher average PPM than the state of Montana.
Billings yearly avg PPM:
Montana yearly avg PPM:
How does pollen in Billings, MT compare to the USA?
Billings has a higher average PPM than the USA.
Billings yearly avg PPM:
USA yearly avg PPM:
Is pollen worse this year in Billings, MT?
Spring 2023 was worse than spring 2022.
Spring 2023 PPM:
Spring 2022 PPM:
Average PPM in Billings, MT
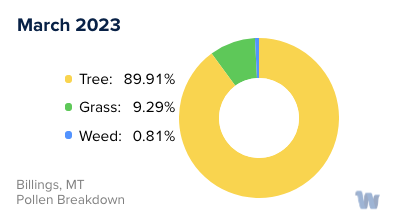
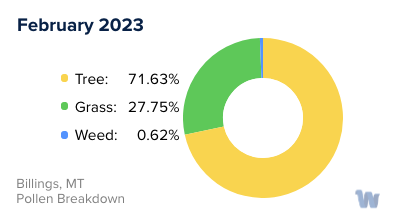
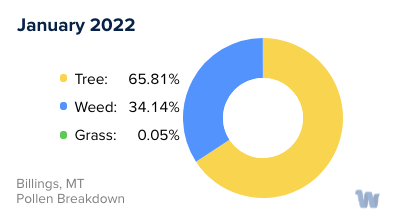
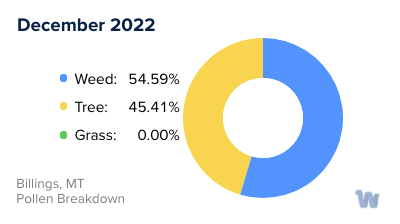
Billings, MT Pollen and Allergy Breakdown by Month
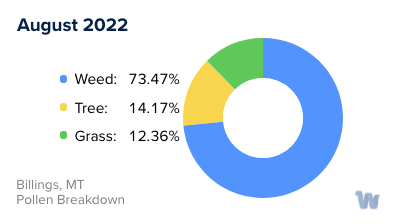
Grass
When is grass pollen highest in Billings, MT?
March has the highest grass pollen in Billings, MT with an average PPM of
When is grass pollen lowest in Billings, MT?
December has the lowest grass pollen in Billings, MT with an average PPM of
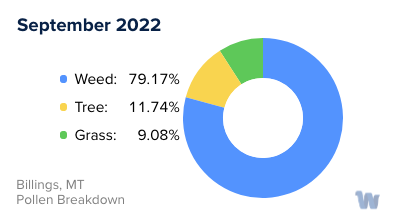
Tree
When is tree pollen highest in Billings, MT?
April has the highest tree pollen in Billings, MT with an average PPM of
When is tree pollen lowest in Billings, MT?
September has the lowest tree pollen in Billings, MT with an average PPM of
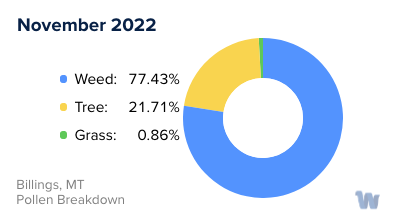
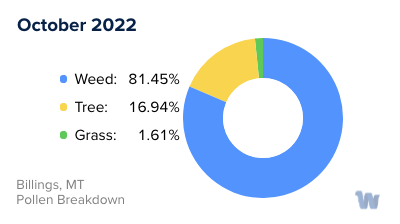
Weed
When is weed pollen highest in Billings, MT?
April has the highest weed pollen in Billings, MT with an average PPM of
When is weed pollen lowest in Billings, MT?
February has the lowest weed pollen in Billings, MT with an average PPM of
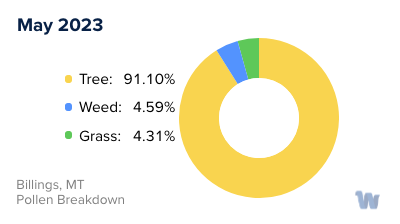
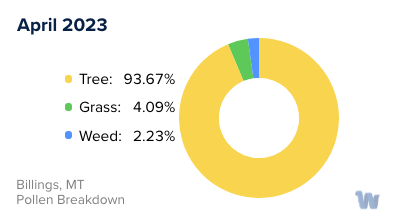
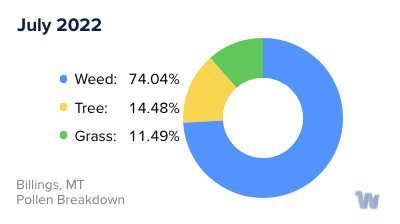
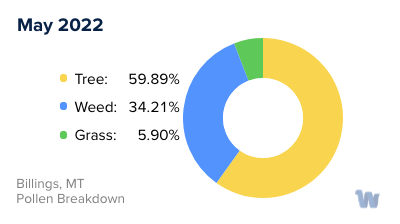
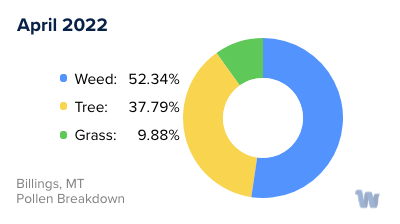
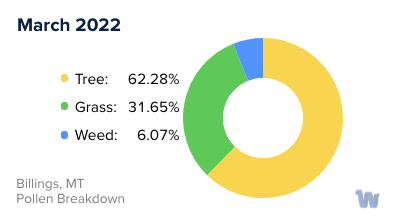
Billings, MT Pollen Monthly Breakdown by Pollen Type

Pollen and Hay Fever in Billings, MT
In the beautiful city of Billings, Montana, pollen allergies, commonly referred to as hay fever, can vary throughout the year due to different types of pollens being present in each season. These allergies are caused by airborne pollen grains from various plants and can lead to symptoms like sneezing, runny or stuffy nose, itchy or watery eyes, and an itchy throat.
The main culprits contributing to pollen allergies in Billings are tree pollen, grass pollen, and ragweed pollen. Each type of pollen has its own peak season, causing varying allergy conditions throughout the year.
Tree pollen, for instance, is generally the first to appear each year. Trees like oak, maple, and pine release their pollen into the air, heralding the onset of allergy season. In Billings, tree pollen levels typically rise in late February or early March and remain high until around May or June. This period signifies the tree allergy season, causing a spike in hay fever symptoms for those sensitive to tree pollen.
As the tree pollen season begins to wane, the grass pollen season starts to ramp up. Grasses such as ryegrass, bluegrass, and timothy release their pollen from June to August. The summer months in Billings see a rise in grass pollen, leading to a surge in allergy symptoms for individuals sensitive to this type of pollen.
Finally, as summer transitions into fall, ragweed pollen takes center stage. Ragweed plants start releasing their pollen into the air from August and continue to do so until the first frost of the season, which typically occurs in November. This period marks the ragweed pollen season in Billings, adding another layer of complexity to the city's pollen landscape.
Overall, understanding the timing and types of pollen present in Billings can help residents and visitors anticipate and manage their allergy symptoms more effectively, even if it doesn't eliminate the discomfort of hay fever.