Boise, ID Pollen and Allergy Report for Summer 2023

Pollen Allergy Trends in Boise, ID

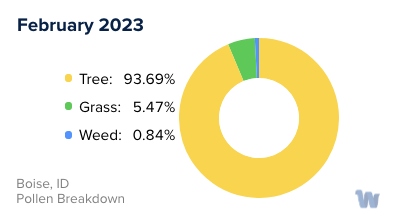
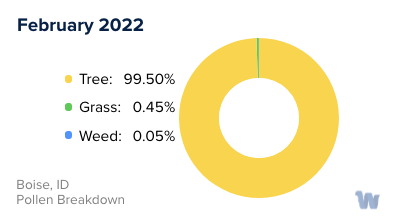
When is pollen lowest in Boise, ID?

Green down arrow

February

Lowest month total PPM

96.22 Avg. PPM

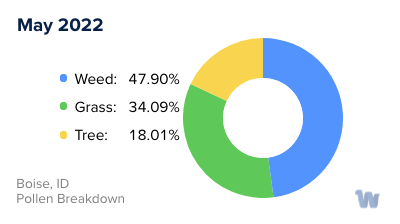
When is pollen highest in Boise, ID?

Red up arrow

May

Highest month total PPM

1,156.62 Avg. PPM

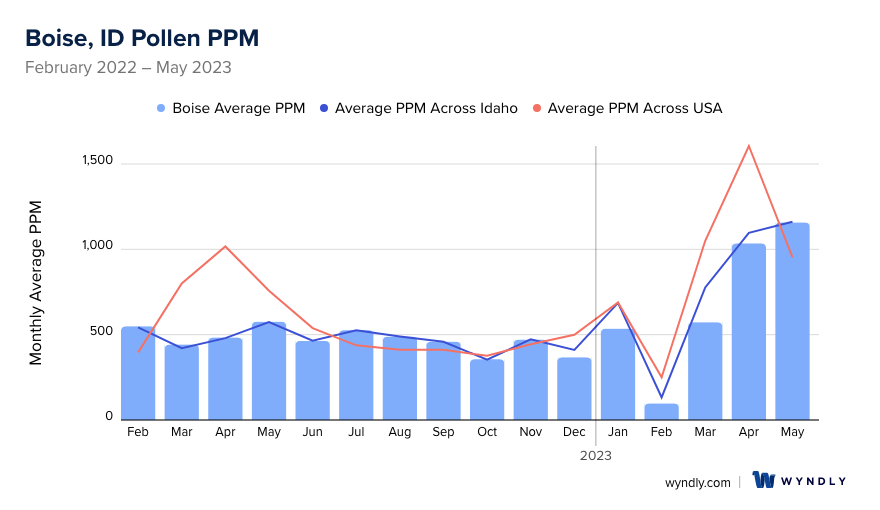
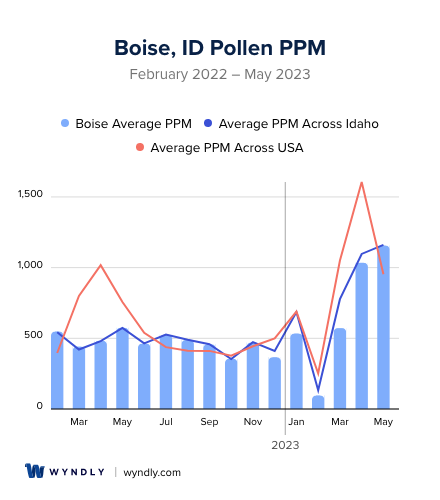
How does pollen in Boise, ID compare to Idaho?

Boise has a lower average PPM than the state of Idaho.

Boise yearly avg PPM: 535.53

Idaho yearly avg PPM: 565.36

How does pollen in Boise, ID compare to the USA?

Boise has a lower average PPM than the USA.

Boise yearly avg PPM: 535.53

USA yearly avg PPM: 664.86

Is pollen worse this year in Boise, ID?

Spring 2023 was worse than spring 2022.

Spring 2023 PPM: 2,762.94

Spring 2022 PPM: 1,499.12

Average PPM in Boise, ID

Boise, ID Average PPM Boise, ID Average PPM

Boise, ID Pollen and Allergy Breakdown by Month

Grass

When is grass pollen highest in Boise, ID?

May has the highest grass pollen in Boise, ID with an average PPM of 196.03

When is grass pollen lowest in Boise, ID?

November has the lowest grass pollen in Boise, ID with an average PPM of
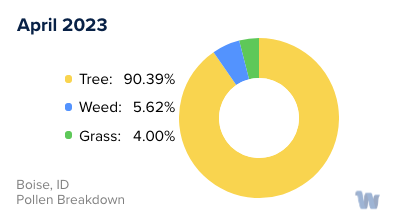
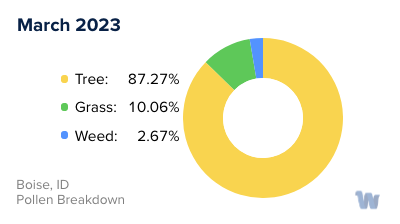
 0

Tree

When is tree pollen highest in Boise, ID?

May has the highest tree pollen in Boise, ID with an average PPM of 1,059.53

When is tree pollen lowest in Boise, ID?

September has the lowest tree pollen in Boise, ID with an average PPM of 56.89

Weed

When is weed pollen highest in Boise, ID?

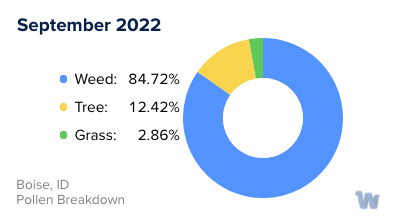
September has the highest weed pollen in Boise, ID with an average PPM of 388.14

When is weed pollen lowest in Boise, ID?

February has the lowest weed pollen in Boise, ID with an average PPM of 0.26

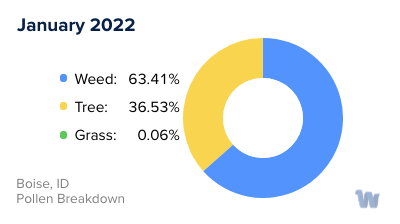
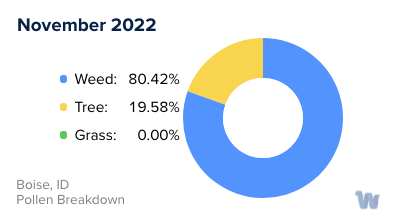
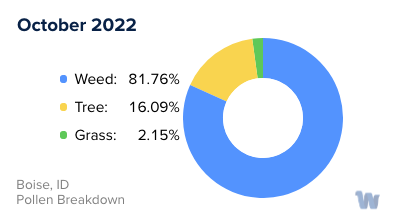
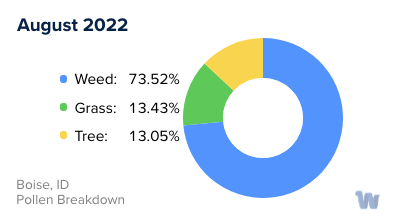
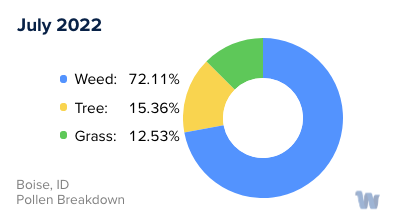
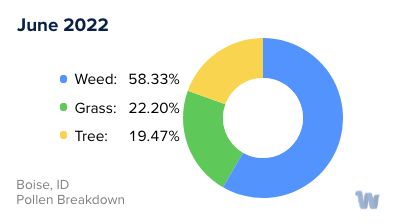
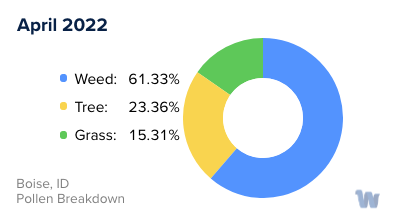
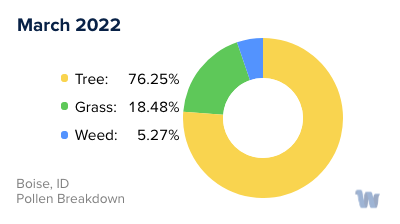
Boise, ID Pollen Monthly Breakdown by Pollen Type

Boise, ID Monthly Pollen Breakdown

Pollen and Hay Fever in Boise, ID

Pollen allergies, often referred to as hay fever, can be a considerable challenge for residents of Boise, Idaho. The city is home to a variety of plants that produce pollen, leading to significant seasonal allergen exposure.

The allergens that primarily affect Boise's population come from trees, grass, and weeds. Tree pollen is most prevalent in the spring, with the most common culprits being juniper, cottonwood, maple, walnut, and willow trees. These tree pollens usually begin to cause symptoms in late February or early March, as Idaho's relatively mild and wet winters give way to spring.

As the season progresses, grass pollen takes center stage during the summer months. Ryegrass, Bermuda grass, orchard grass, and bluegrass are among the types of grasses that contribute to the high pollen counts during this season.

As summer transitions into fall, weed pollen becomes the main allergen. This category includes allergens from plants like sagebrush, pigweed, and tumbleweed. These weed pollens often persist into late summer and continue until the end of the allergy season.

The allergy season in Boise typically reaches its peak in April, June, and September. These are the months when residents are most likely to experience severe allergy symptoms due to high pollen counts. However, the first frost, which usually occurs around late October, brings a welcome respite from outdoor allergens.

In conclusion, while the exact timing and severity of allergy seasons can vary from year to year, those living in Boise, Idaho, are primarily affected by tree pollen in the spring, grass pollen in the summer, and weed pollen in the fall. Understanding these patterns can help residents prepare for the challenges of each allergy season.

Boise, ID Map

What is Wyndly?

Wyndly is the easiest and most convenient way to fix your allergies forever. As an online allergy practice, Wyndly offers at-home allergy testing and treatment. The main goal of Wyndly is to retrain the immune system to stop responding to allergens, providing lasting relief from allergies.

Here's how Wyndly works:

  1. Identify Allergy Triggers: The first step is to identify the allergy triggers. You can purchase an at-home allergy test from Wyndly, or if you have already done an allergy test elsewhere, you can share your existing test results. This allows the doctors at Wyndly to pinpoint which allergies need to be treated.
  2. Get Treated by a Real Doctor: Using medications that are similar to those used in allergy shots, a doctor creates a unique sublingual immunotherapy treatment plan to desensitize your immune system. This is done using FDA-approved sublingual tablets or clinically proven dosing for oral use.
  3. Live Better Without Symptoms: The prescriptions are shipped to your door, and the doctor works with you until you’re better. Wyndly offers regular online check-ins with US-licensed physicians and 24/7 availability for questions or concerns via text, email, or call.

The treatment plans are personalized based on your specific allergy triggers and aim to treat allergies at their source, rather than just relieving symptoms for a short period. Most people report improvement in as little as one month.

Start with Wyndly today

Wyndly Summer 2023 Pollen Report Methodology

For each city, Wyndly obtained monthly pollen PPMs (pollen grains per cubic meter) for each form (tree, grass, and weed) from February 2022 - May 2023. Data were obtained from Pollen Sense, LLC Automated Particulate Sensors (APS). These sensors automatically detect particulate matter collected from ambient air, and use a neural network algorithm to identify individual pollen species and calculate daily pollen counts.

Yearly averages are calculated by summing the three allergen averages per month of data for a total monthly PPM, summing all monthly total PPMs, then dividing by 12 (month count). Used for per-city average, state average, and total USA average. Season comparisons are done by summing the months of Spring (March, April, May) for 2023 and 2022. If the absolute of the (2023-2022)/2022 is ≤ 0.05, the years were about the same. Otherwise, the more PPM, the worse the season was.

Is Wyndly right for you?

Answer just a few questions and we'll help you find out.

Get Started Today

Pollen and Allergy Reports by City