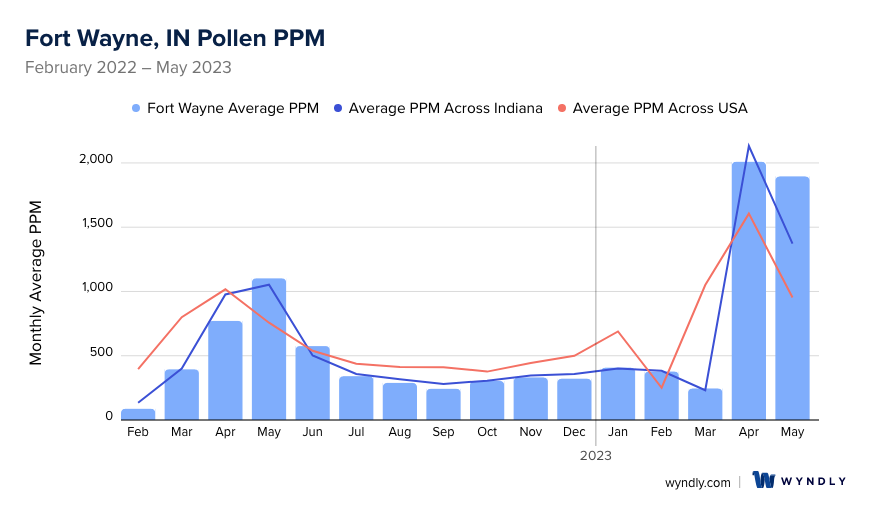
Fort Wayne, IN Pollen and Allergy Report for Summer 2023

Pollen Allergy Trends in Fort Wayne, IN

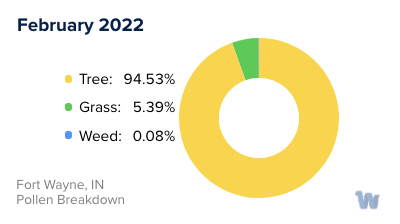
When is pollen lowest in Fort Wayne, IN?

Green down arrow

February

Lowest month total PPM

87 Avg. PPM

When is pollen highest in Fort Wayne, IN?

Red up arrow

April

Highest month total PPM

2,008.58 Avg. PPM

How does pollen in Fort Wayne, IN compare to Indiana?

Fort Wayne has a higher average PPM than the state of Indiana.

Fort Wayne yearly avg PPM: 605.63

Indiana yearly avg PPM: 596.89

How does pollen in Fort Wayne, IN compare to the USA?

Fort Wayne has a lower average PPM than the USA.

Fort Wayne yearly avg PPM: 605.63

USA yearly avg PPM: 664.86

Is pollen worse this year in Fort Wayne, IN?

Spring 2023 was worse than spring 2022.

Spring 2023 PPM: 4,149.35

Spring 2022 PPM: 2,266.66

Average PPM in Fort Wayne, IN

Fort Wayne, IN Average PPM Fort Wayne, IN Average PPM

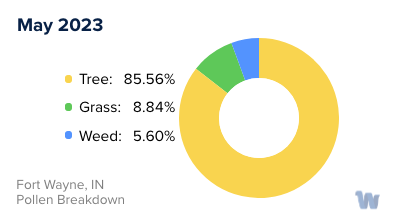
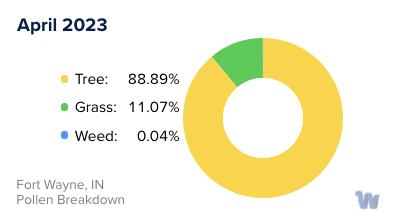
Fort Wayne, IN Pollen and Allergy Breakdown by Month

Grass

When is grass pollen highest in Fort Wayne, IN?

April has the highest grass pollen in Fort Wayne, IN with an average PPM of 222.28

When is grass pollen lowest in Fort Wayne, IN?

October has the lowest grass pollen in Fort Wayne, IN with an average PPM of 0

Tree

When is tree pollen highest in Fort Wayne, IN?

April has the highest tree pollen in Fort Wayne, IN with an average PPM of 1,785.42

When is tree pollen lowest in Fort Wayne, IN?

July has the lowest tree pollen in Fort Wayne, IN with an average PPM of 50.22

Weed

When is weed pollen highest in Fort Wayne, IN?

April has the highest weed pollen in Fort Wayne, IN with an average PPM of 470.42

When is weed pollen lowest in Fort Wayne, IN?

February has the lowest weed pollen in Fort Wayne, IN with an average PPM of 0.07

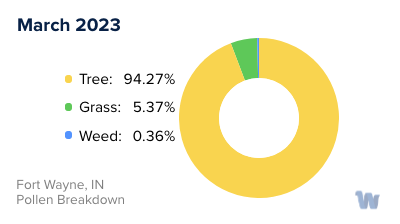
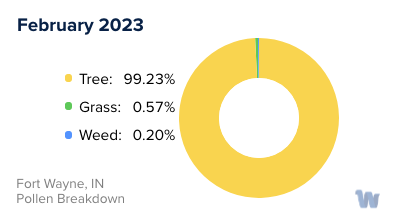
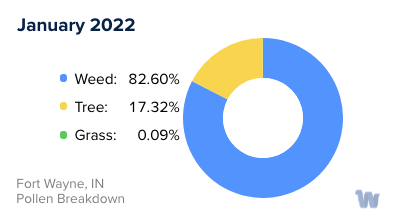
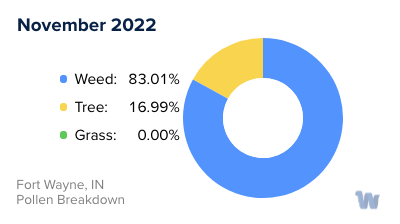
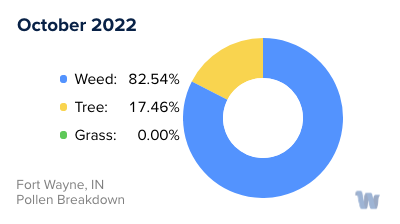
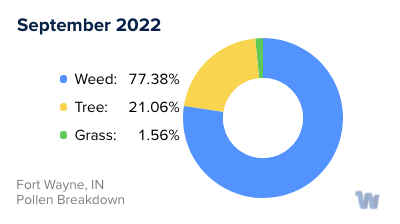
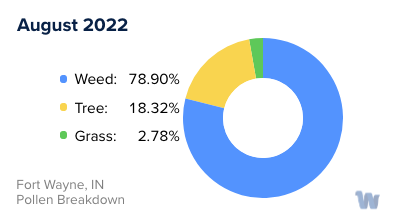
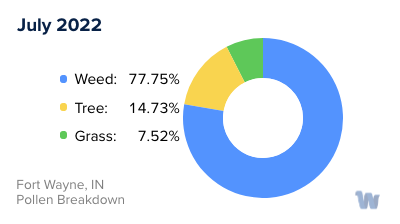
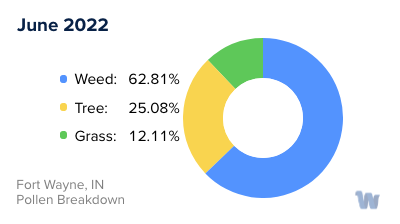
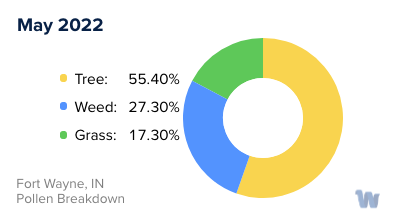
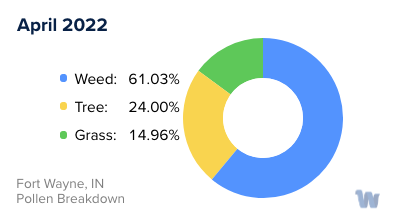
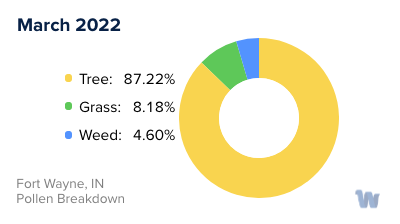
Fort Wayne, IN Pollen Monthly Breakdown by Pollen Type

Fort Wayne, IN Monthly Pollen Breakdown

Pollen and Hay Fever in Fort Wayne, IN

Pollen allergies, also known as hay fever, are a common issue for residents of Fort Wayne, Indiana. Three primary types of pollen contribute to these allergies: tree pollen, grass pollen, and ragweed pollen.

Tree pollen is one of the first allergens to appear as winter transitions to spring. Starting in late February or early March, trees such as hickory, oak, maple, willow, ash, privet, cedar, and mulberry begin releasing their pollen into the air. The tree pollen season in Fort Wayne typically tapers off in May, providing some respite to those who are particularly sensitive to this type of pollen.

As spring turns to summer, grass pollen takes the stage. This type of pollen is usually most prevalent from the end of May until August. Grasses such as bent, timothy, sweet vernal, orchard, fescue, and prairie grasses are the most common triggers of grass pollen allergies in Fort Wayne.

Finally, as summer fades into fall, ragweed pollen becomes the primary concern. The ragweed pollen season begins in mid-August and continues until the arrival of the first hard winter freeze. Besides ragweed, other weed allergens include wormwood, sagebrush, amaranth, and orache.

While winter offers a break from outdoor pollen allergies, indoor allergens can still cause issues year-round. Nonetheless, understanding the different types of pollen and their respective seasons can help residents of Fort Wayne prepare for and navigate the challenges of pollen allergies, ensuring they can still enjoy the beauty of their city throughout the year.

Fort Wayne, IN Map

What is Wyndly?

Wyndly is the easiest and most convenient way to fix your allergies forever. As an online allergy practice, Wyndly offers at-home allergy testing and treatment. The main goal of Wyndly is to retrain the immune system to stop responding to allergens, providing lasting relief from allergies.

Here's how Wyndly works:

  1. Identify Allergy Triggers: The first step is to identify the allergy triggers. You can purchase an at-home allergy test from Wyndly, or if you have already done an allergy test elsewhere, you can share your existing test results. This allows the doctors at Wyndly to pinpoint which allergies need to be treated.
  2. Get Treated by a Real Doctor: Using medications that are similar to those used in allergy shots, a doctor creates a unique sublingual immunotherapy treatment plan to desensitize your immune system. This is done using FDA-approved sublingual tablets or clinically proven dosing for oral use.
  3. Live Better Without Symptoms: The prescriptions are shipped to your door, and the doctor works with you until you’re better. Wyndly offers regular online check-ins with US-licensed physicians and 24/7 availability for questions or concerns via text, email, or call.

The treatment plans are personalized based on your specific allergy triggers and aim to treat allergies at their source, rather than just relieving symptoms for a short period. Most people report improvement in as little as one month.

Start with Wyndly today

Wyndly Summer 2023 Pollen Report Methodology

For each city, Wyndly obtained monthly pollen PPMs (pollen grains per cubic meter) for each form (tree, grass, and weed) from February 2022 - May 2023. Data were obtained from Pollen Sense, LLC Automated Particulate Sensors (APS). These sensors automatically detect particulate matter collected from ambient air, and use a neural network algorithm to identify individual pollen species and calculate daily pollen counts.

Yearly averages are calculated by summing the three allergen averages per month of data for a total monthly PPM, summing all monthly total PPMs, then dividing by 12 (month count). Used for per-city average, state average, and total USA average. Season comparisons are done by summing the months of Spring (March, April, May) for 2023 and 2022. If the absolute of the (2023-2022)/2022 is ≤ 0.05, the years were about the same. Otherwise, the more PPM, the worse the season was.

Is Wyndly right for you?

Answer just a few questions and we'll help you find out.

Get Started Today

Pollen and Allergy Reports by City