Davenport, IA Pollen and Allergy Report for Summer 2023

Pollen Allergy Trends in Davenport, IA
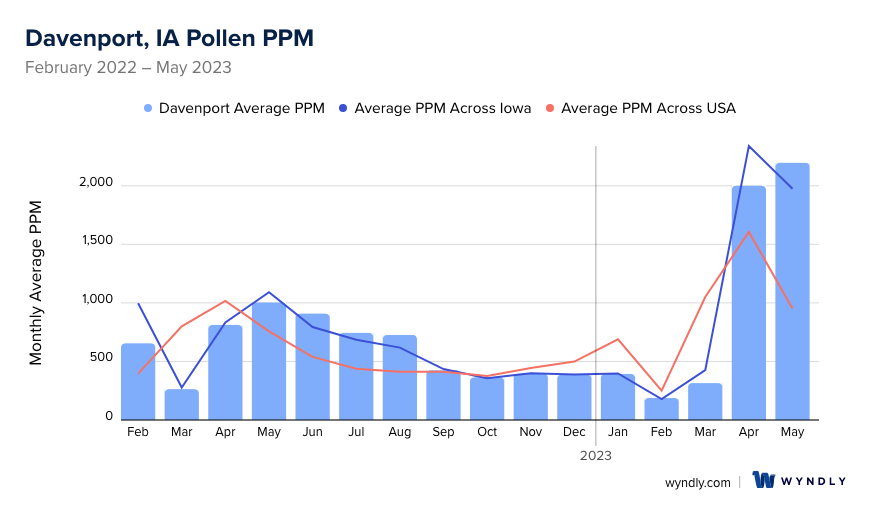
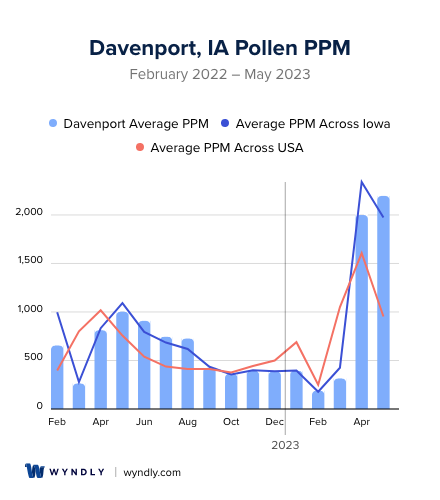
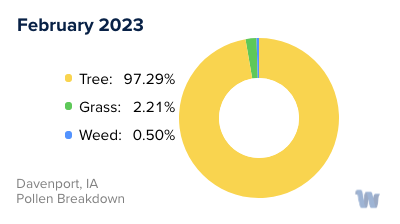
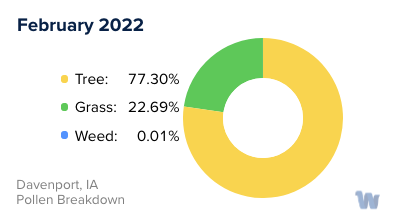
When is pollen lowest in Davenport, IA?
February
Lowest month total PPM
Avg. PPM
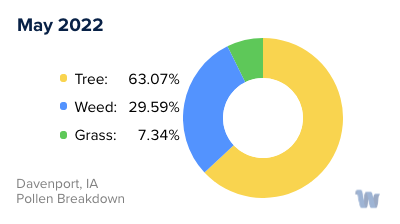
When is pollen highest in Davenport, IA?
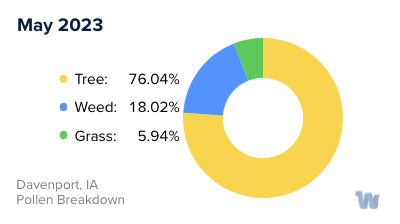
May
Highest month total PPM
Avg. PPM
How does pollen in Davenport, IA compare to Iowa?
Davenport has a lower average PPM than the state of Iowa.
Davenport yearly avg PPM:
Iowa yearly avg PPM:
How does pollen in Davenport, IA compare to the USA?
Davenport has a higher average PPM than the USA.
Davenport yearly avg PPM:
USA yearly avg PPM:
Is pollen worse this year in Davenport, IA?
Spring 2023 was worse than spring 2022.
Spring 2023 PPM:
Spring 2022 PPM:
Average PPM in Davenport, IA
Davenport, IA Pollen and Allergy Breakdown by Month
Grass
When is grass pollen highest in Davenport, IA?
July has the highest grass pollen in Davenport, IA with an average PPM of
When is grass pollen lowest in Davenport, IA?
October has the lowest grass pollen in Davenport, IA with an average PPM of
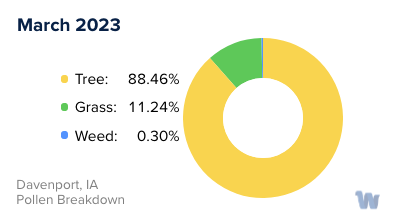
Tree
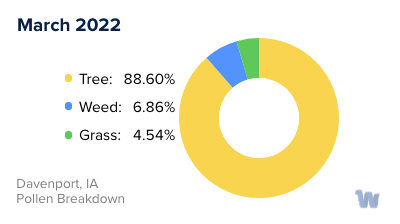
When is tree pollen highest in Davenport, IA?
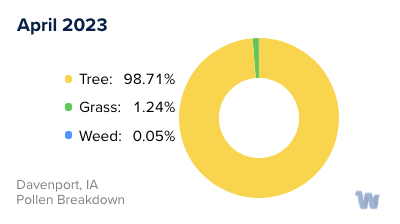
April has the highest tree pollen in Davenport, IA with an average PPM of
When is tree pollen lowest in Davenport, IA?
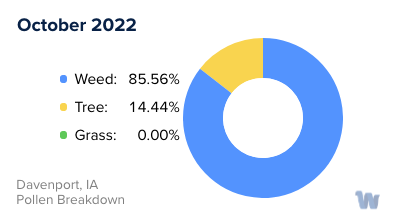
October has the lowest tree pollen in Davenport, IA with an average PPM of
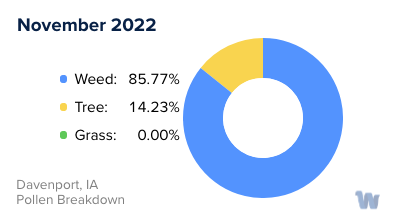
Weed
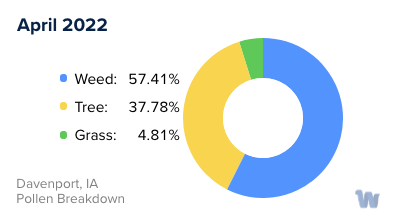
When is weed pollen highest in Davenport, IA?
April has the highest weed pollen in Davenport, IA with an average PPM of
When is weed pollen lowest in Davenport, IA?
February has the lowest weed pollen in Davenport, IA with an average PPM of
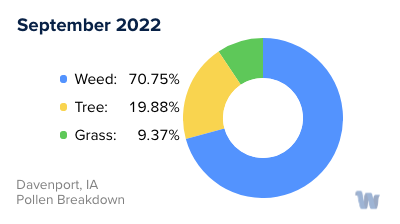
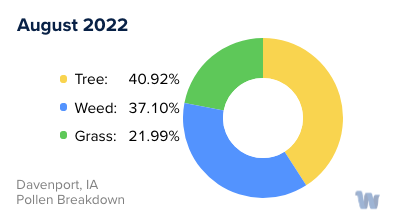
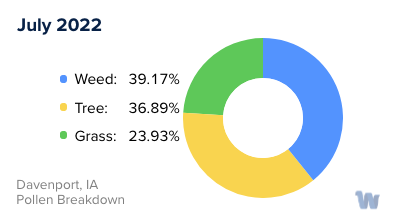
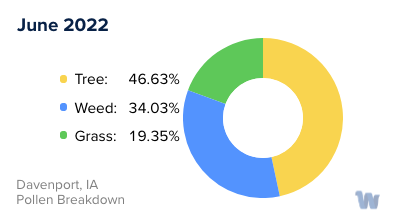
Davenport, IA Pollen Monthly Breakdown by Pollen Type


Pollen and Hay Fever in Davenport, IA
Hay fever, or allergic rhinitis, is a common affliction in Davenport, Iowa, often triggered by an allergic reaction to pollen from various plants. Understanding the types of pollen prevalent in Davenport and their respective seasons can help those affected anticipate and manage their symptoms.
The types of pollen that typically affect individuals in Davenport are tree pollen, grass pollen, and ragweed pollen. Each has its own distinct season, influenced by the cycles of the plants that produce them.
Tree pollen is a significant allergen in the spring season. This is the period when many trees release their pollen into the air, which can cause allergic reactions in sensitive individuals. Trees in the Davenport area, such as oaks, maples, and pines, can all contribute to the pollen count during this time of year.
Grass pollen becomes a concern in the summer. This is when grasses such as Bermuda grass, Timothy grass, and Kentucky bluegrass produce and release their pollen, leading to increased symptoms for allergy sufferers. The levels can vary from day to day, with some days being particularly high in grass pollen.
Finally, ragweed pollen is a primary cause of fall allergies. Ragweed, a plant that thrives in the Midwest, releases its pollen from mid-August to mid-September. Though the ragweed season is shorter compared to the tree and grass pollen seasons, it can be quite intense, causing significant discomfort for those allergic to this type of pollen.
In conclusion, Davenport's location in the Midwest Mississippi Valley allergy region means that its residents can experience pollen allergies during spring, summer, and fall, each season marked by a different type of pollen - tree, grass, and ragweed, respectively. Knowing the types of pollen and their seasons can be instrumental in managing and anticipating the onset of hay fever symptoms.