Glendale, AZ Pollen and Allergy Report for Summer 2023

Pollen Allergy Trends in Glendale, AZ

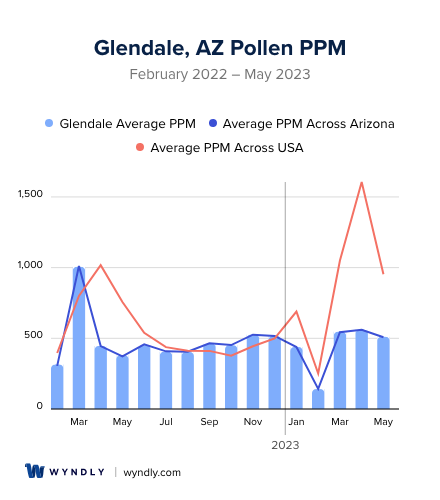
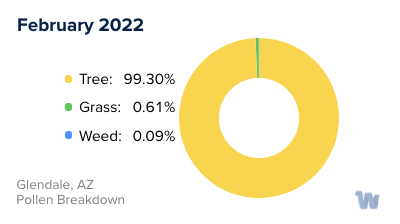
When is pollen lowest in Glendale, AZ?

Green down arrow

February

Lowest month total PPM

140.72 Avg. PPM

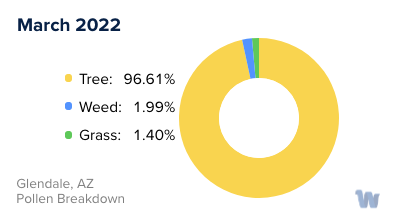
When is pollen highest in Glendale, AZ?

Red up arrow

March

Highest month total PPM

1,005.6 Avg. PPM

How does pollen in Glendale, AZ compare to Arizona?

Glendale has a higher average PPM than the state of Arizona.

Glendale yearly avg PPM: 472.58

Arizona yearly avg PPM: 472.29

How does pollen in Glendale, AZ compare to the USA?

Glendale has a lower average PPM than the USA.

Glendale yearly avg PPM: 472.58

USA yearly avg PPM: 664.86

Is pollen worse this year in Glendale, AZ?

Spring 2023 was better than spring 2022.

Spring 2023 PPM: 1,618.73

Spring 2022 PPM: 1,831.56

Average PPM in Glendale, AZ

Glendale, AZ Average PPM Glendale, AZ Average PPM

Glendale, AZ Pollen and Allergy Breakdown by Month

Grass

When is grass pollen highest in Glendale, AZ?

May has the highest grass pollen in Glendale, AZ with an average PPM of 111.3

When is grass pollen lowest in Glendale, AZ?

December has the lowest grass pollen in Glendale, AZ with an average PPM of 0

Tree

When is tree pollen highest in Glendale, AZ?

March has the highest tree pollen in Glendale, AZ with an average PPM of 971.53

When is tree pollen lowest in Glendale, AZ?

July has the lowest tree pollen in Glendale, AZ with an average PPM of 55.49

Weed

When is weed pollen highest in Glendale, AZ?

December has the highest weed pollen in Glendale, AZ with an average PPM of 453.58

When is weed pollen lowest in Glendale, AZ?

February has the lowest weed pollen in Glendale, AZ with an average PPM of 0.27

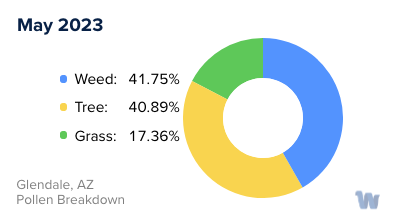
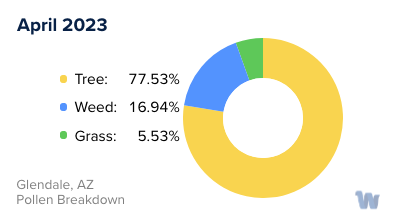
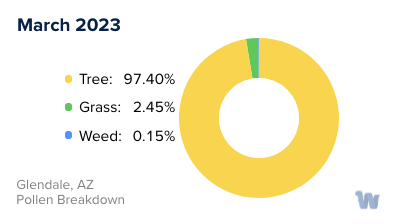
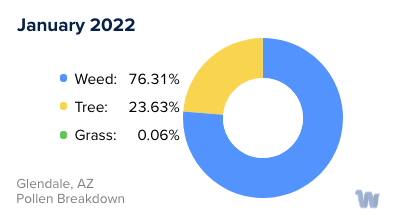
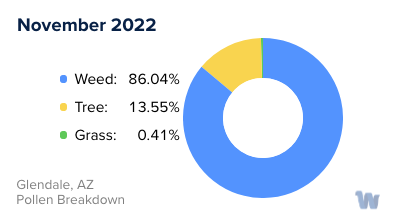
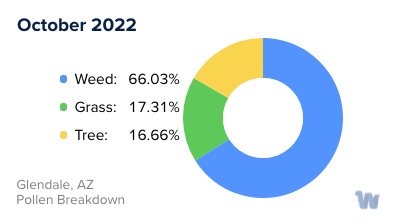
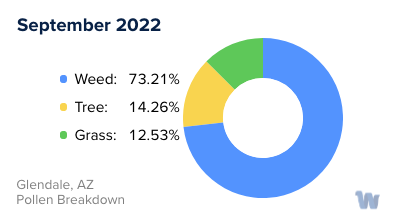
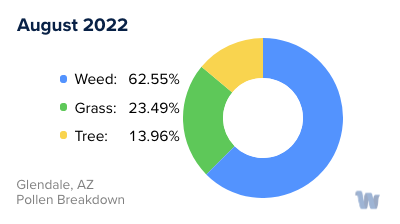
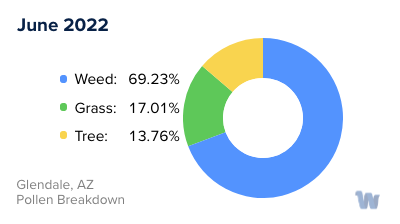
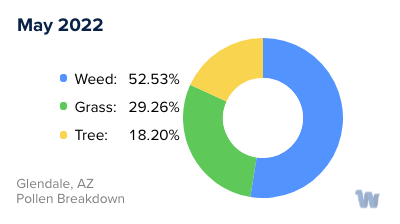
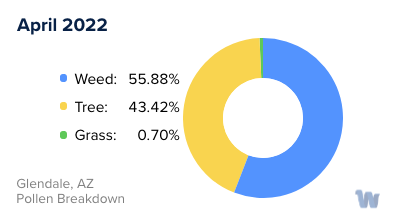
Glendale, AZ Pollen Monthly Breakdown by Pollen Type

Glendale, AZ Monthly Pollen Breakdown

Pollen and Hay Fever in Glendale, AZ

In the sunny city of Glendale, Arizona, pollen allergies, often referred to as hay fever, can be a common nuisance for many residents. In general, the types of pollen causing these allergies vary depending on the season.

Tree pollen is a significant allergen, and in Arizona, residents encounter tree pollen mainly during the winter and spring. Some of the common trees that contribute to this pollen load include Ash, Mesquite, Mulberry, Cottonwood, Oak, and Olive.

Grass pollen, on the other hand, is predominantly produced during the summer months. Bermuda grass, a common grass variety in Arizona, is a significant contributor to the grass pollen count during this season. The density of grass pollen in the air can reach high levels, making summer a challenging time for those with sensitivities to this type of pollen.

Weeds also play a role in pollen allergies. In Arizona, weeds primarily produce pollen in the fall, extending into winter. Ragweed and Russian thistle are among the main culprits.

Seasonal allergies in Arizona typically peak in April, May, and September. During these months, the pollen count can be particularly high. However, due to the state's dry and warm climate, pollen allergies can occur year-round, albeit at lower levels during off-peak times. Therefore, residents and visitors alike should be mindful of the changing pollen landscape throughout the year.

Pollen allergies can be disruptive and uncomfortable, but understanding the types of pollen prevalent in your area and their seasonal patterns can help you anticipate and manage your symptoms effectively.

Glendale, AZ Map

What is Wyndly?

Wyndly is the easiest and most convenient way to fix your allergies forever. As an online allergy practice, Wyndly offers at-home allergy testing and treatment. The main goal of Wyndly is to retrain the immune system to stop responding to allergens, providing lasting relief from allergies.

Here's how Wyndly works:

  1. Identify Allergy Triggers: The first step is to identify the allergy triggers. You can purchase an at-home allergy test from Wyndly, or if you have already done an allergy test elsewhere, you can share your existing test results. This allows the doctors at Wyndly to pinpoint which allergies need to be treated.
  2. Get Treated by a Real Doctor: Using medications that are similar to those used in allergy shots, a doctor creates a unique sublingual immunotherapy treatment plan to desensitize your immune system. This is done using FDA-approved sublingual tablets or clinically proven dosing for oral use.
  3. Live Better Without Symptoms: The prescriptions are shipped to your door, and the doctor works with you until you’re better. Wyndly offers regular online check-ins with US-licensed physicians and 24/7 availability for questions or concerns via text, email, or call.

The treatment plans are personalized based on your specific allergy triggers and aim to treat allergies at their source, rather than just relieving symptoms for a short period. Most people report improvement in as little as one month.

Start with Wyndly today

Wyndly Summer 2023 Pollen Report Methodology

For each city, Wyndly obtained monthly pollen PPMs (pollen grains per cubic meter) for each form (tree, grass, and weed) from February 2022 - May 2023. Data were obtained from Pollen Sense, LLC Automated Particulate Sensors (APS). These sensors automatically detect particulate matter collected from ambient air, and use a neural network algorithm to identify individual pollen species and calculate daily pollen counts.

Yearly averages are calculated by summing the three allergen averages per month of data for a total monthly PPM, summing all monthly total PPMs, then dividing by 12 (month count). Used for per-city average, state average, and total USA average. Season comparisons are done by summing the months of Spring (March, April, May) for 2023 and 2022. If the absolute of the (2023-2022)/2022 is ≤ 0.05, the years were about the same. Otherwise, the more PPM, the worse the season was.

Is Wyndly right for you?

Answer just a few questions and we'll help you find out.

Get Started Today

Pollen and Allergy Reports by City