Oxnard, CA Pollen and Allergy Report for Summer 2023

Pollen Allergy Trends in Oxnard, CA
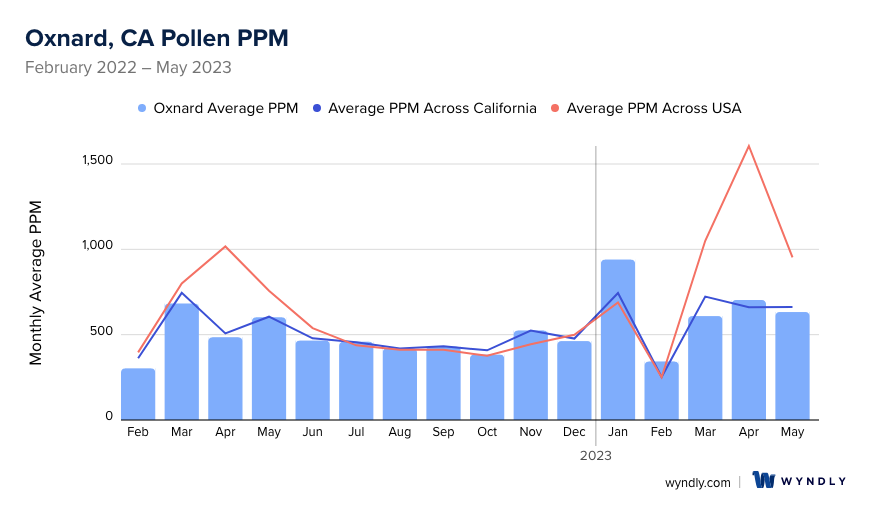
When is pollen lowest in Oxnard, CA?
February
Lowest month total PPM
Avg. PPM
When is pollen highest in Oxnard, CA?
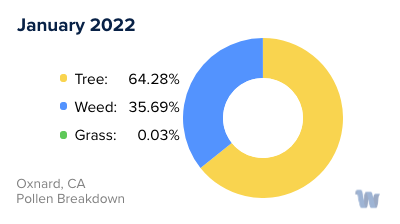
January
Highest month total PPM
Avg. PPM
How does pollen in Oxnard, CA compare to California?
Oxnard has a lower average PPM than the state of California.
Oxnard yearly avg PPM:
California yearly avg PPM:
How does pollen in Oxnard, CA compare to the USA?
Oxnard has a lower average PPM than the USA.
Oxnard yearly avg PPM:
USA yearly avg PPM:
Is pollen worse this year in Oxnard, CA?
Spring 2023 was worse than spring 2022.
Spring 2023 PPM:
Spring 2022 PPM:
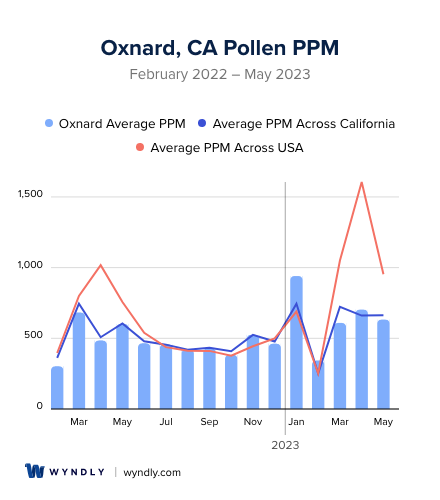
Average PPM in Oxnard, CA
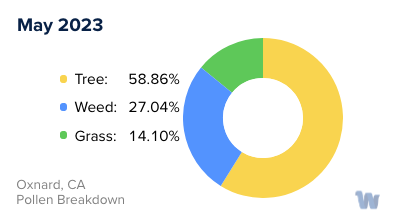
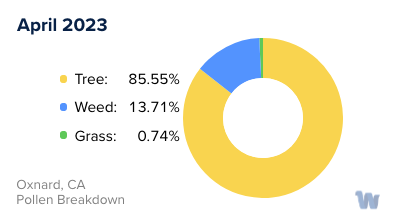
Oxnard, CA Pollen and Allergy Breakdown by Month
Grass
When is grass pollen highest in Oxnard, CA?
May has the highest grass pollen in Oxnard, CA with an average PPM of
When is grass pollen lowest in Oxnard, CA?
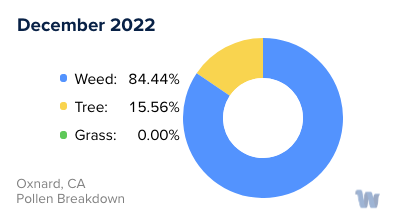
December has the lowest grass pollen in Oxnard, CA with an average PPM of
Tree
When is tree pollen highest in Oxnard, CA?
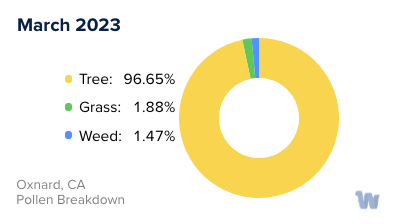
March has the highest tree pollen in Oxnard, CA with an average PPM of
When is tree pollen lowest in Oxnard, CA?
August has the lowest tree pollen in Oxnard, CA with an average PPM of
Weed
When is weed pollen highest in Oxnard, CA?
November has the highest weed pollen in Oxnard, CA with an average PPM of
When is weed pollen lowest in Oxnard, CA?
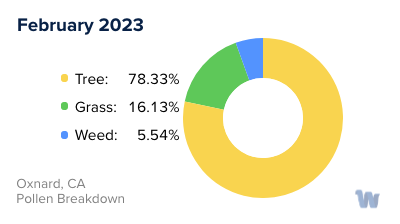
February has the lowest weed pollen in Oxnard, CA with an average PPM of
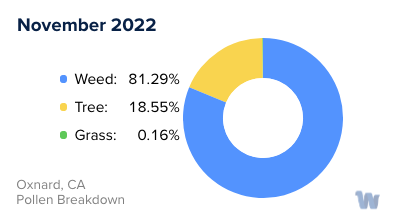
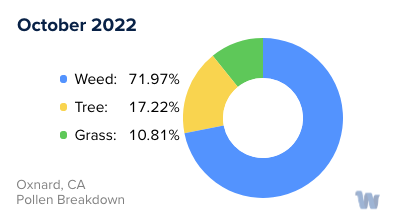
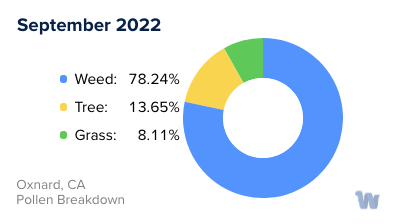
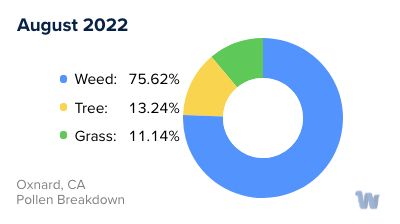
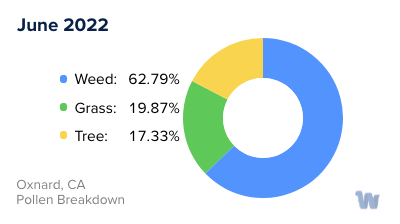
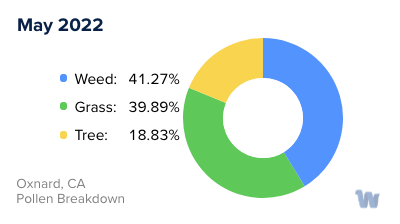
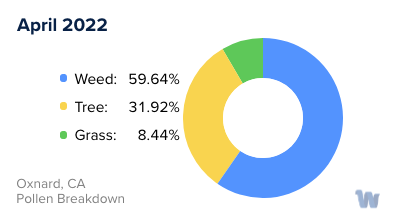
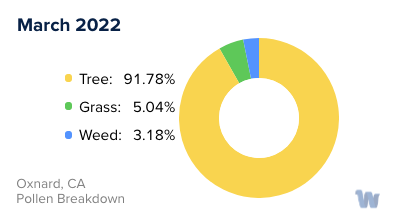
Oxnard, CA Pollen Monthly Breakdown by Pollen Type


Pollen and Hay Fever in Oxnard, CA
Living in the sunny coastal city of Oxnard, California, one can enjoy the year-round mild climate, beautiful beaches, and fertile agricultural lands. However, for some residents, the city's natural beauty comes with a downside: pollen allergies, also known as hay fever.
Pollen allergies are an overreaction of the immune system to pollen, a fine powder released by plants as part of their reproductive cycle. In Oxnard, where a variety of plants thrive due to the region's favorable climate, several types of pollen can trigger allergic reactions.
One major offender is grass pollen, particularly from ryegrass and Bermuda grass, which are common in Southern California landscapes. This type of pollen is typically highest in the late spring and early summer, causing many residents to experience hay fever symptoms such as sneezing, runny nose, and itchy eyes during this time.
The city is also known for its abundant fruit and vegetable crops, which can contribute to pollen allergies. Among these, the olive tree deserves special mention. Although beautiful and symbolic of the Mediterranean climate, olive trees produce a highly allergenic pollen. Olive tree pollen is most prevalent in the late spring and early summer, overlapping with the grass pollen season.
In addition to grass and olive trees, ragweed, a plant that is widespread across the United States, is present in Oxnard. Ragweed pollen, which can travel long distances on the wind, is usually highest in the late summer and fall.
Living in Oxnard thus means experiencing a nearly year-round pollen season, with different types of pollen peaking at different times. This can be challenging for individuals with pollen allergies, as it may seem like their symptoms never fully subside. Despite these challenges, understanding the types of pollen and their seasons can help residents anticipate and manage their allergies more effectively, making it easier for them to continue enjoying all the natural beauty Oxnard has to offer.