Des Moines, IA Pollen and Allergy Report for Summer 2023

Pollen Allergy Trends in Des Moines, IA
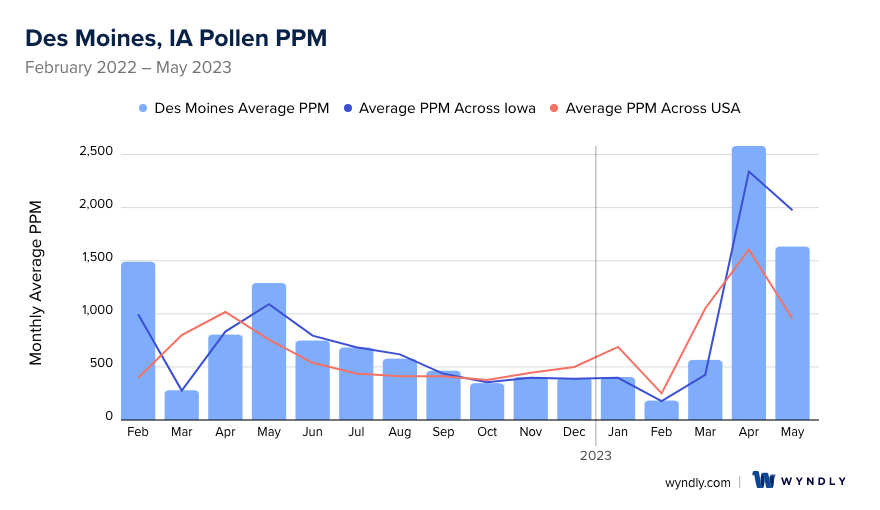
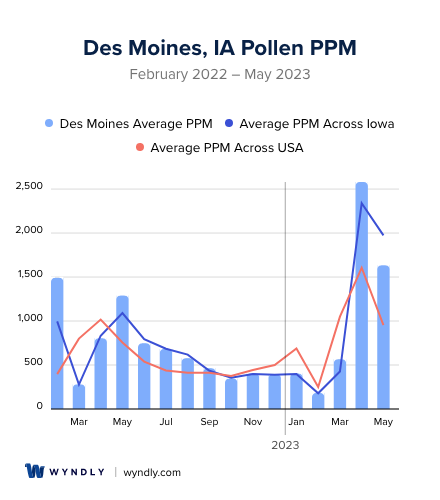
When is pollen lowest in Des Moines, IA?
February
Lowest month total PPM
Avg. PPM
When is pollen highest in Des Moines, IA?
April
Highest month total PPM
Avg. PPM
How does pollen in Des Moines, IA compare to Iowa?
Des Moines has a higher average PPM than the state of Iowa.
Des Moines yearly avg PPM:
Iowa yearly avg PPM:
How does pollen in Des Moines, IA compare to the USA?
Des Moines has a higher average PPM than the USA.
Des Moines yearly avg PPM:
USA yearly avg PPM:
Is pollen worse this year in Des Moines, IA?
Spring 2023 was worse than spring 2022.
Spring 2023 PPM:
Spring 2022 PPM:
Average PPM in Des Moines, IA
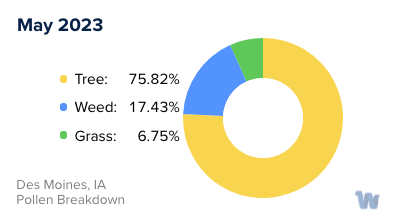
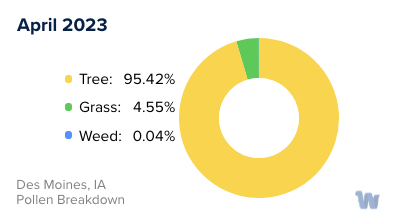
Des Moines, IA Pollen and Allergy Breakdown by Month
Grass
When is grass pollen highest in Des Moines, IA?
February has the highest grass pollen in Des Moines, IA with an average PPM of
When is grass pollen lowest in Des Moines, IA?
October has the lowest grass pollen in Des Moines, IA with an average PPM of
Tree
When is tree pollen highest in Des Moines, IA?
April has the highest tree pollen in Des Moines, IA with an average PPM of
When is tree pollen lowest in Des Moines, IA?
October has the lowest tree pollen in Des Moines, IA with an average PPM of
Weed
When is weed pollen highest in Des Moines, IA?
April has the highest weed pollen in Des Moines, IA with an average PPM of
When is weed pollen lowest in Des Moines, IA?
February has the lowest weed pollen in Des Moines, IA with an average PPM of
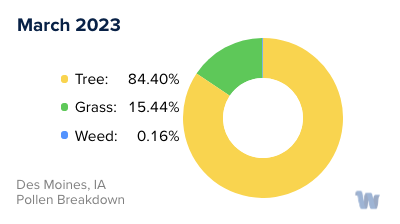
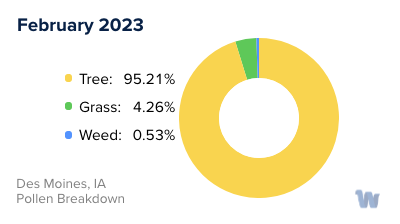
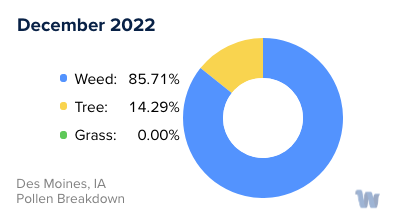
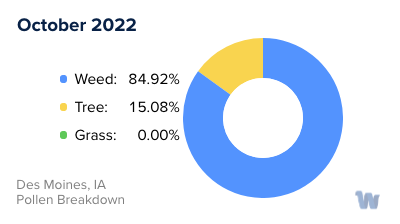
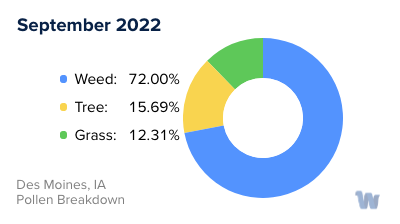
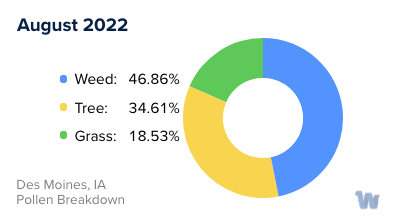
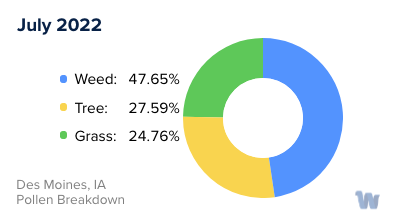
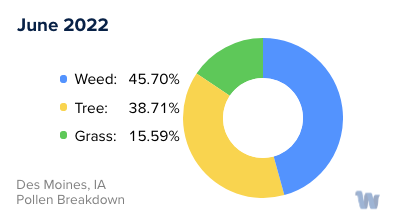
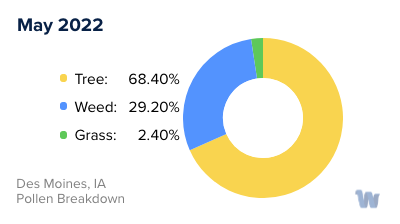
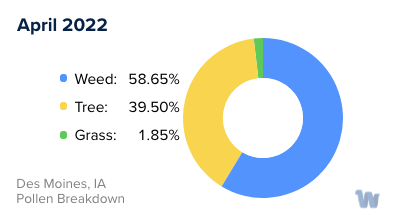
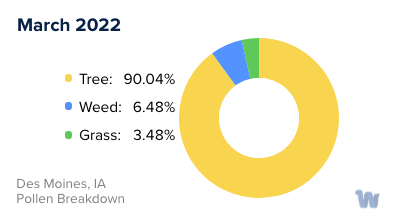
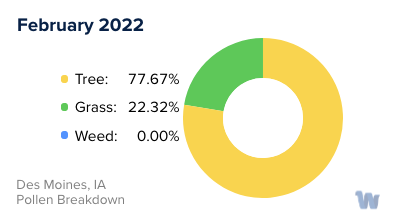
Des Moines, IA Pollen Monthly Breakdown by Pollen Type


Pollen and Hay Fever in Des Moines, IA
The ebbs and flows of the seasons are often accompanied by a host of sensory experiences, from the vibrant colors of fall leaves to the fresh bloom of spring flowers. However, for many residents of Des Moines, Iowa, the changing seasons also bring about something less pleasant: pollen allergies, commonly known as hay fever.
Pollen allergies arise when the immune system responds to harmless pollen as if it were a harmful invader. The result is a series of symptoms that can include sneezing, itchy eyes, and a runny nose.
In Des Moines, there are three primary types of pollen that cause the majority of hay fever symptoms: tree pollen, grass pollen, and weed pollen.
Tree pollen tends to be most prevalent in the spring. The region's diverse tree population, including oaks, maples, and cedars, can create a significant pollen output. The drift of these tiny particles in the breeze can be beautiful to witness, but they're a major culprit for springtime sniffles.
As we transition into the warm summer months, grass pollen takes center stage. Rye grass, Kentucky bluegrass, and Timothy grass are particularly common in Iowa and are known for their high pollen production.
Lastly, as summer gives way to fall, weed pollen – particularly from ragweed – becomes the primary allergen. Ragweed, a plant that thrives in the Midwest's fertile soils, is notorious for its ability to produce a large amount of pollen.
So while the changing seasons in Des Moines offer a visual feast of changing landscapes, they also bring a cycle of different pollens. Each type of pollen has its own 'high season', leading to a virtually year-round allergy season for sensitive individuals. It's important for those affected to be aware of these patterns, as understanding the source of these symptoms is the first step towards managing them. Just remember, it's not the plants' fault – they're just trying to reproduce!.