Jurupa Valley, CA Pollen and Allergy Report for Summer 2023

Pollen Allergy Trends in Jurupa Valley, CA

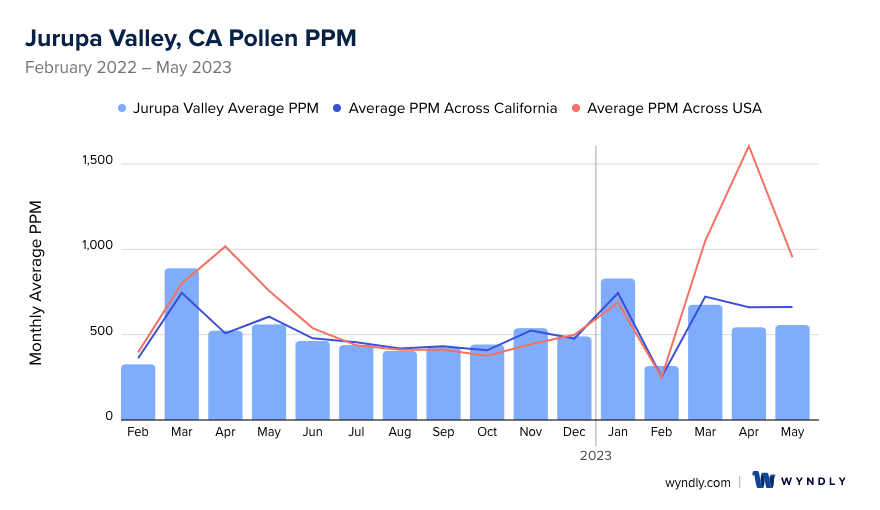
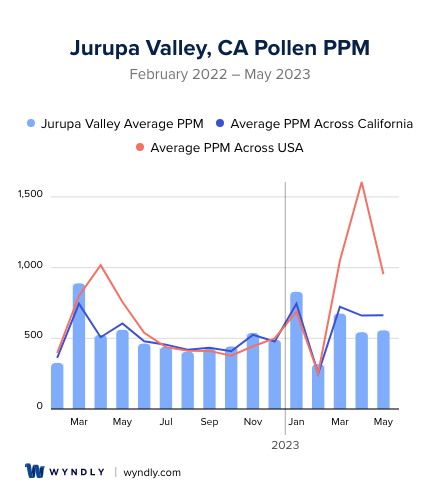
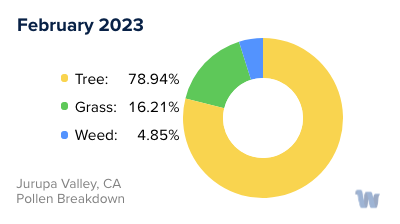
When is pollen lowest in Jurupa Valley, CA?
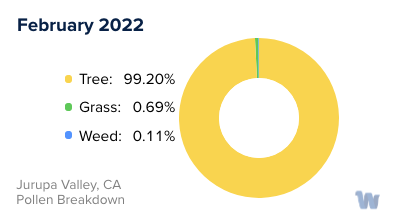
Green down arrow

February

Lowest month total PPM

316.68 Avg. PPM

When is pollen highest in Jurupa Valley, CA?

Red up arrow

March

Highest month total PPM

888.84 Avg. PPM

How does pollen in Jurupa Valley, CA compare to California?

Jurupa Valley has a lower average PPM than the state of California.

Jurupa Valley yearly avg PPM: 526.31

California yearly avg PPM: 528.52

How does pollen in Jurupa Valley, CA compare to the USA?

Jurupa Valley has a lower average PPM than the USA.

Jurupa Valley yearly avg PPM: 526.31

USA yearly avg PPM: 664.86

Is pollen worse this year in Jurupa Valley, CA?

Spring 2023 was better than spring 2022.

Spring 2023 PPM: 1,774.81

Spring 2022 PPM: 1,972.34

Average PPM in Jurupa Valley, CA

Jurupa Valley, CA Average PPM Jurupa Valley, CA Average PPM

Jurupa Valley, CA Pollen and Allergy Breakdown by Month
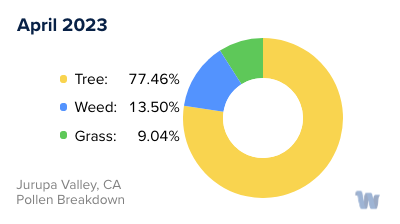
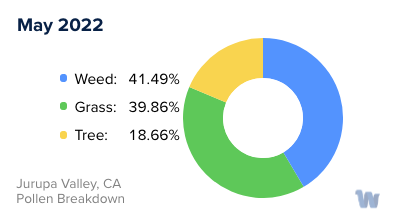
Grass

When is grass pollen highest in Jurupa Valley, CA?

May has the highest grass pollen in Jurupa Valley, CA with an average PPM of 223.16

When is grass pollen lowest in Jurupa Valley, CA?

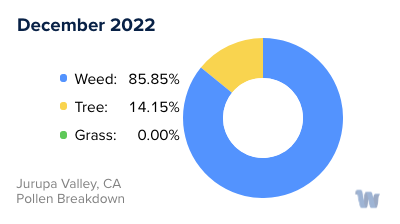
December has the lowest grass pollen in Jurupa Valley, CA with an average PPM of
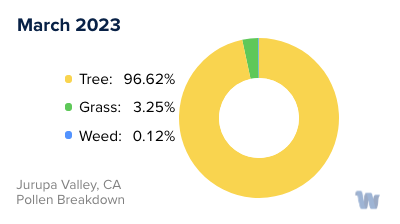
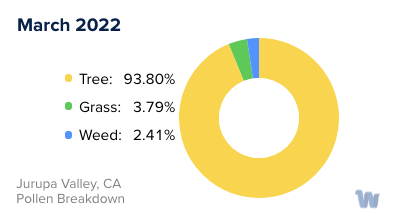
 0

Tree

When is tree pollen highest in Jurupa Valley, CA?

March has the highest tree pollen in Jurupa Valley, CA with an average PPM of 833.72

When is tree pollen lowest in Jurupa Valley, CA?

August has the lowest tree pollen in Jurupa Valley, CA with an average PPM of
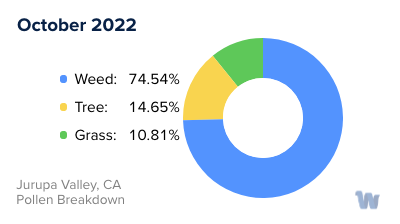
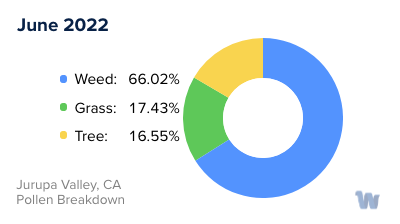
 56.38

Weed

When is weed pollen highest in Jurupa Valley, CA?

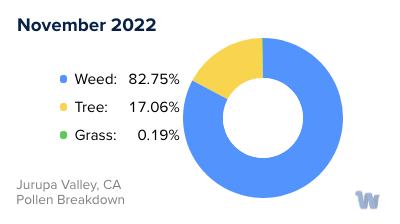
November has the highest weed pollen in Jurupa Valley, CA with an average PPM of 445.38

When is weed pollen lowest in Jurupa Valley, CA?

February has the lowest weed pollen in Jurupa Valley, CA with an average PPM of 0.35

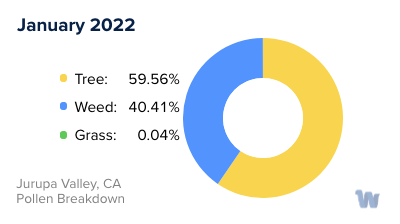
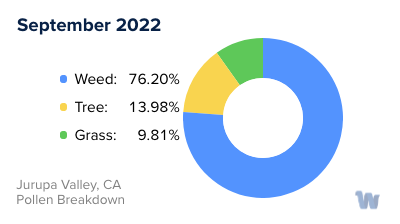
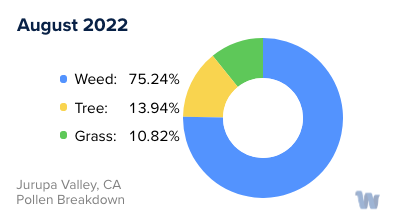
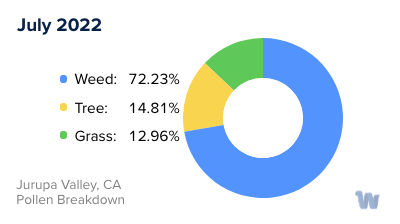
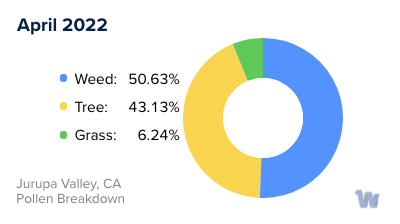
Jurupa Valley, CA Pollen Monthly Breakdown by Pollen Type

Jurupa Valley, CA Monthly Pollen Breakdown

Pollen and Hay Fever in Jurupa Valley, CA

Pollen allergies, often referred to as hay fever, are a common concern for residents of Jurupa Valley, California. With its unique geographic position and climate, the city experiences different types of pollen throughout the year that can trigger allergic reactions.

The primary sources of pollen in Jurupa Valley are trees, grass, and weeds, with specific pollen types like willow and pine being more prevalent. While these pollen types are common across many regions, their occurrence in Jurupa Valley and their effects on the population can be quite specific due to local environmental factors.

In terms of timing, the allergy season in Jurupa Valley, like the rest of California, is quite extended. Allergy symptoms related to pollen can flare up in the spring, summer, and fall. Typically, the allergy season starts around late January, a bit earlier than many other states due to California's milder winters.

The peak periods for pollen allergies usually occur in April, May, and September. During these months, the pollen counts are typically at their highest. This increase in pollen can lead to a surge in allergy symptoms among sensitive individuals.

By the time October or November rolls around, the allergy season usually winds down. While the winter season brings milder weather and a decrease in outdoor allergens like pollen, it's worth noting that indoor allergens can still trigger symptoms in some individuals.

Understanding the types of pollen and their seasons in Jurupa Valley is essential for residents and visitors alike. This knowledge can help individuals take necessary precautions, plan outdoor activities strategically, and maintain their comfort and well-being throughout the year.

Jurupa Valley, CA Map

What is Wyndly?

Wyndly is the easiest and most convenient way to fix your allergies forever. As an online allergy practice, Wyndly offers at-home allergy testing and treatment. The main goal of Wyndly is to retrain the immune system to stop responding to allergens, providing lasting relief from allergies.

Here's how Wyndly works:

  1. Identify Allergy Triggers: The first step is to identify the allergy triggers. You can purchase an at-home allergy test from Wyndly, or if you have already done an allergy test elsewhere, you can share your existing test results. This allows the doctors at Wyndly to pinpoint which allergies need to be treated.
  2. Get Treated by a Real Doctor: Using medications that are similar to those used in allergy shots, a doctor creates a unique sublingual immunotherapy treatment plan to desensitize your immune system. This is done using FDA-approved sublingual tablets or clinically proven dosing for oral use.
  3. Live Better Without Symptoms: The prescriptions are shipped to your door, and the doctor works with you until you’re better. Wyndly offers regular online check-ins with US-licensed physicians and 24/7 availability for questions or concerns via text, email, or call.

The treatment plans are personalized based on your specific allergy triggers and aim to treat allergies at their source, rather than just relieving symptoms for a short period. Most people report improvement in as little as one month.

Start with Wyndly today

Wyndly Summer 2023 Pollen Report Methodology

For each city, Wyndly obtained monthly pollen PPMs (pollen grains per cubic meter) for each form (tree, grass, and weed) from February 2022 - May 2023. Data were obtained from Pollen Sense, LLC Automated Particulate Sensors (APS). These sensors automatically detect particulate matter collected from ambient air, and use a neural network algorithm to identify individual pollen species and calculate daily pollen counts.

Yearly averages are calculated by summing the three allergen averages per month of data for a total monthly PPM, summing all monthly total PPMs, then dividing by 12 (month count). Used for per-city average, state average, and total USA average. Season comparisons are done by summing the months of Spring (March, April, May) for 2023 and 2022. If the absolute of the (2023-2022)/2022 is ≤ 0.05, the years were about the same. Otherwise, the more PPM, the worse the season was.

Is Wyndly right for you?

Answer just a few questions and we'll help you find out.

Get Started Today

Pollen and Allergy Reports by City