Chattanooga, TN Pollen and Allergy Report for Summer 2023

Pollen Allergy Trends in Chattanooga, TN
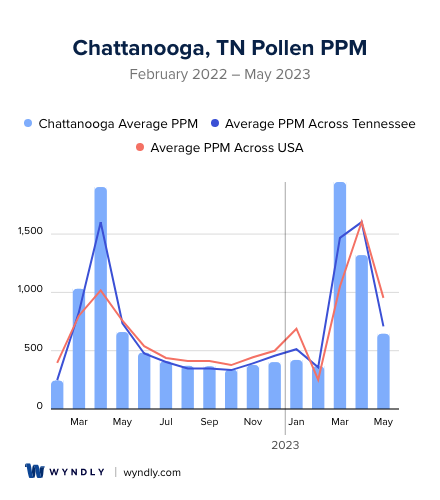
When is pollen lowest in Chattanooga, TN?
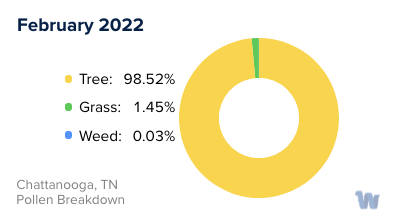
February
Lowest month total PPM
Avg. PPM
When is pollen highest in Chattanooga, TN?
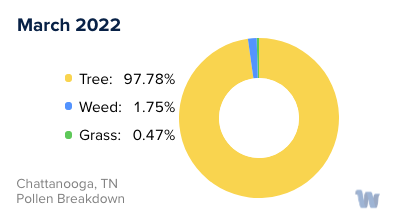
March
Highest month total PPM
Avg. PPM
How does pollen in Chattanooga, TN compare to Tennessee?
Chattanooga has a higher average PPM than the state of Tennessee.
Chattanooga yearly avg PPM:
Tennessee yearly avg PPM:
How does pollen in Chattanooga, TN compare to the USA?
Chattanooga has a higher average PPM than the USA.
Chattanooga yearly avg PPM:
USA yearly avg PPM:
Is pollen worse this year in Chattanooga, TN?
Spring 2023 was worse than spring 2022.
Spring 2023 PPM:
Spring 2022 PPM:
Average PPM in Chattanooga, TN

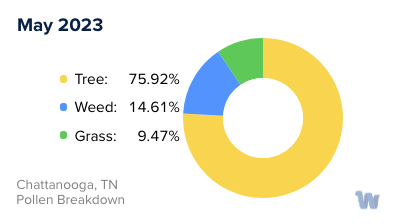
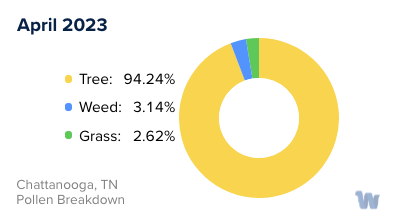
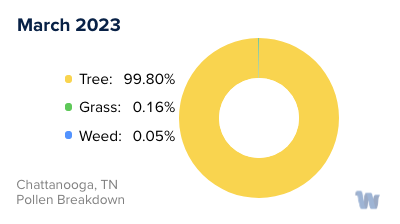
Chattanooga, TN Pollen and Allergy Breakdown by Month
Grass
When is grass pollen highest in Chattanooga, TN?
April has the highest grass pollen in Chattanooga, TN with an average PPM of
When is grass pollen lowest in Chattanooga, TN?
October has the lowest grass pollen in Chattanooga, TN with an average PPM of
Tree
When is tree pollen highest in Chattanooga, TN?
March has the highest tree pollen in Chattanooga, TN with an average PPM of
When is tree pollen lowest in Chattanooga, TN?
September has the lowest tree pollen in Chattanooga, TN with an average PPM of
Weed
When is weed pollen highest in Chattanooga, TN?
April has the highest weed pollen in Chattanooga, TN with an average PPM of
When is weed pollen lowest in Chattanooga, TN?
February has the lowest weed pollen in Chattanooga, TN with an average PPM of
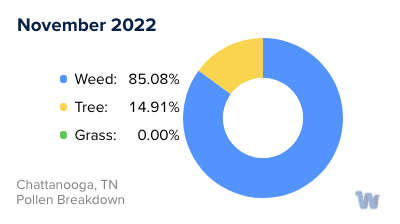
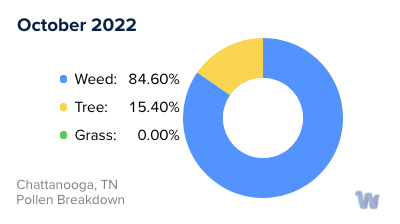
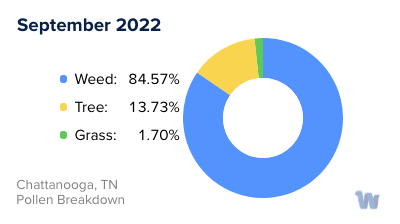
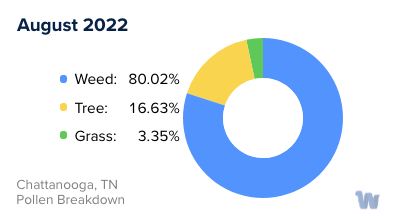
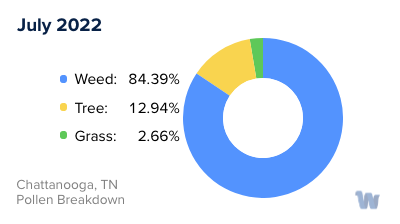
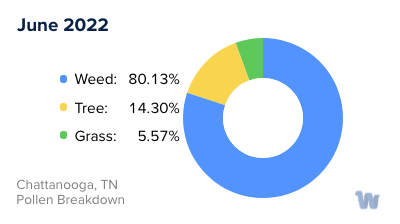
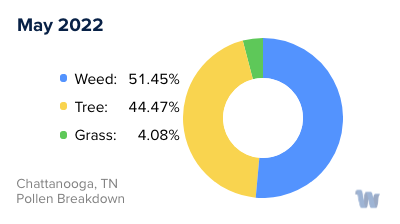
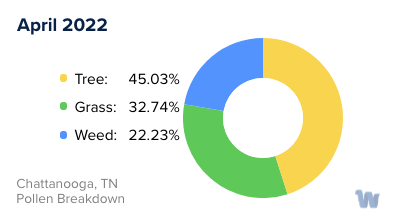
Chattanooga, TN Pollen Monthly Breakdown by Pollen Type


Pollen and Hay Fever in Chattanooga, TN
In the heart of the Tennessee Valley, the city of Chattanooga grapples with a reality that many of its residents are all too familiar with: pollen allergies, often leading to a condition known as hay fever.
Pollen allergies are a widespread issue in Chattanooga, primarily due to the city's rich biodiversity. Among the most common culprits are trees, grasses, and weeds, each releasing their own distinct type of pollen that can trigger allergic reactions.
Tree pollen is generally the first to arrive on the scene, kicking off the allergy season. As spring awakens, so too does the city's population of oak, pine, and hickory trees, releasing copious amounts of pollen into the air. This usually occurs from late February through May, turning cars and patio furniture a telltale shade of yellow.
Following the tree pollen season, grasses take center stage in late spring and early summer. Bermuda grass, ryegrass, and Kentucky bluegrass are among the most common in the Chattanooga area, and each contributes to the pollen count. Walking barefoot through a grassy field may be a summer staple, but for those with grass pollen allergies, it can trigger a slew of symptoms.
In late summer and fall, the weed pollen season comes into full swing. Ragweed, a plant that thrives in Chattanooga's climate, is a significant contributor. While it may seem less conspicuous than a towering oak or a lush patch of grass, ragweed packs a punch when it comes to pollen production.
Throughout the year, Chattanooga's diverse array of plant life contributes to varying levels of pollen in the air. Understanding the types of pollen and the timing of their release can help residents prepare for the allergy season. Remember, knowledge is the first step in navigating the pollen-rich landscapes of Chattanooga. Just don't forget your tissues!.