Chula Vista, CA Pollen and Allergy Report for Summer 2023

Pollen Allergy Trends in Chula Vista, CA
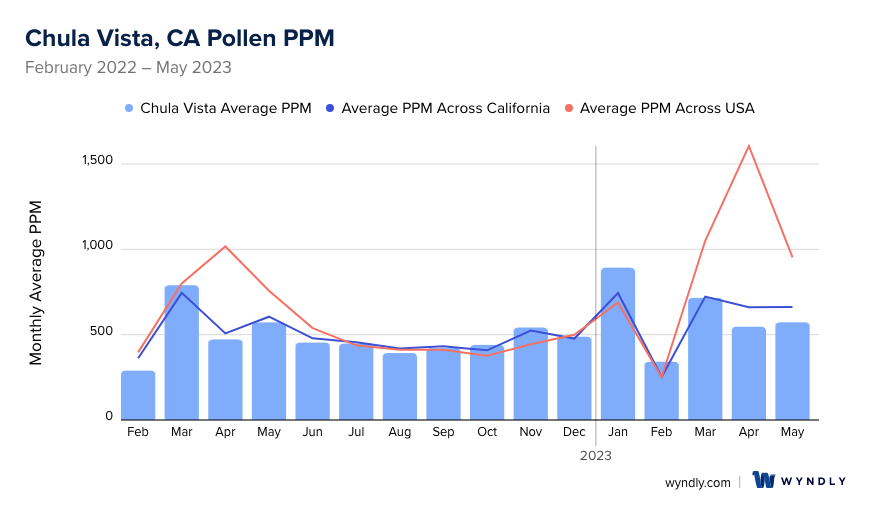
When is pollen lowest in Chula Vista, CA?
February
Lowest month total PPM
Avg. PPM
When is pollen highest in Chula Vista, CA?
January
Highest month total PPM
Avg. PPM
How does pollen in Chula Vista, CA compare to California?
Chula Vista has a lower average PPM than the state of California.
Chula Vista yearly avg PPM:
California yearly avg PPM:
How does pollen in Chula Vista, CA compare to the USA?
Chula Vista has a lower average PPM than the USA.
Chula Vista yearly avg PPM:
USA yearly avg PPM:
Is pollen worse this year in Chula Vista, CA?
Spring 2023 was about the same as 2022.
Spring 2023 PPM:
Spring 2022 PPM:
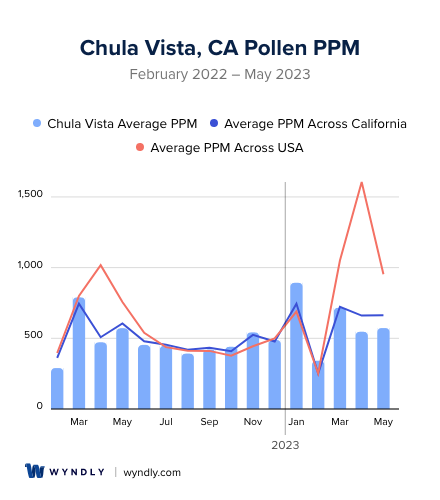
Average PPM in Chula Vista, CA
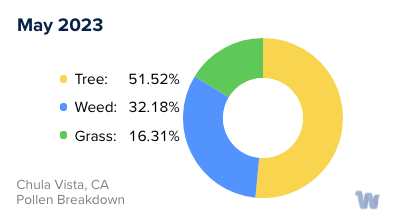
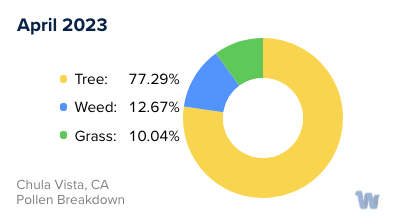
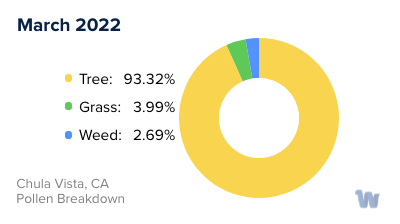
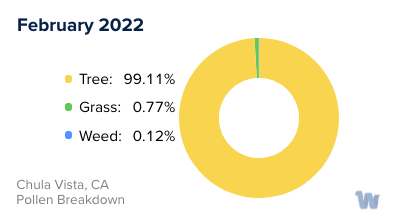
Chula Vista, CA Pollen and Allergy Breakdown by Month
Grass
When is grass pollen highest in Chula Vista, CA?
May has the highest grass pollen in Chula Vista, CA with an average PPM of
When is grass pollen lowest in Chula Vista, CA?
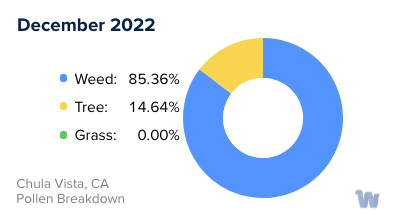
December has the lowest grass pollen in Chula Vista, CA with an average PPM of
Tree
When is tree pollen highest in Chula Vista, CA?
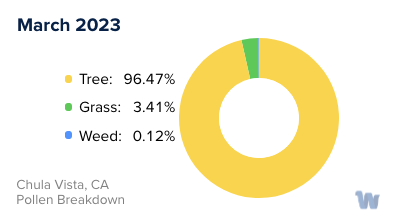
March has the highest tree pollen in Chula Vista, CA with an average PPM of
When is tree pollen lowest in Chula Vista, CA?
August has the lowest tree pollen in Chula Vista, CA with an average PPM of
Weed
When is weed pollen highest in Chula Vista, CA?
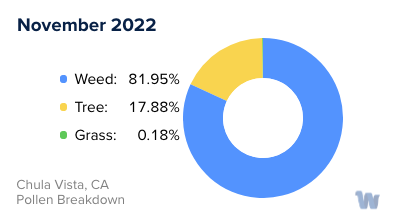
November has the highest weed pollen in Chula Vista, CA with an average PPM of
When is weed pollen lowest in Chula Vista, CA?
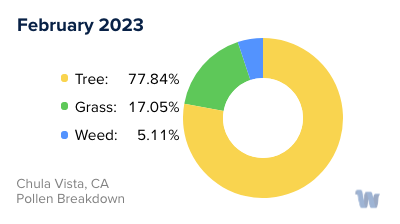
February has the lowest weed pollen in Chula Vista, CA with an average PPM of
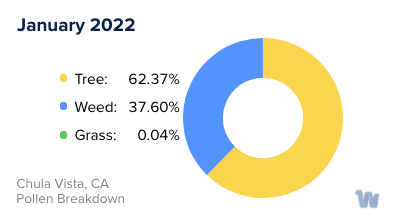
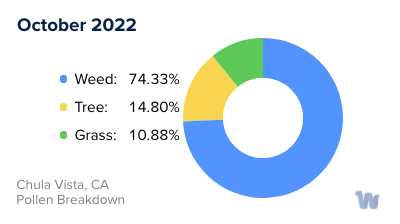
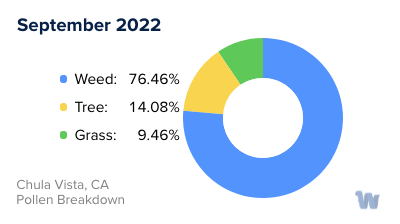
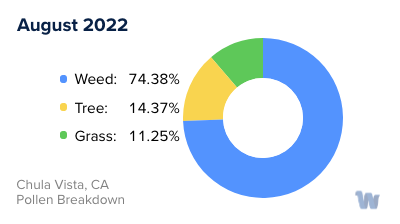
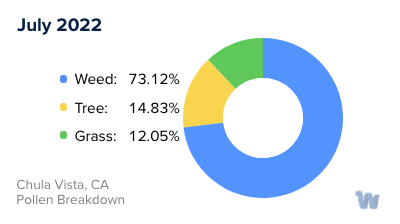
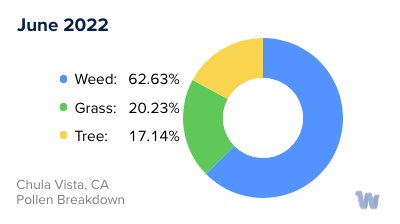
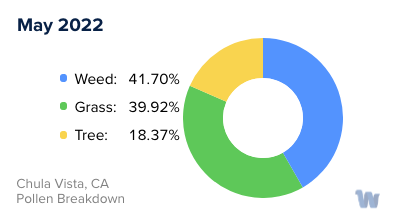
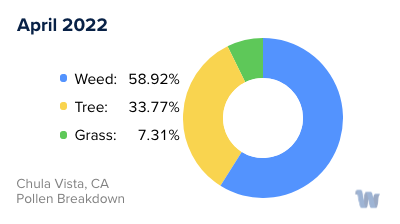
Chula Vista, CA Pollen Monthly Breakdown by Pollen Type
Pollen and Hay Fever in Chula Vista, CA
Pollen allergies, also commonly known as hay fever, are a frequent concern for residents of Chula Vista, California. This coastal city, nestled between San Diego Bay and coastal mountain foothills, is home to a unique variety of plant species that contribute to the pollen count.
In Chula Vista, the primary culprits for pollen allergies are trees, grasses, and weeds. The types of pollen that people react to vary, often depending on what plants are indigenous to or commonly found in the area.
Tree pollen is typically the first to appear in the year, often starting in late winter or early spring. Oak, pine, and olive trees are prevalent in Chula Vista, and they all release pollen that can trigger allergies. This can lead to symptoms like sneezing, runny nose, itchy eyes, and coughing, making the beautiful spring season a challenging time for those with tree pollen allergies.
As spring transitions into summer, grass pollen takes center stage. Bermuda grass, ryegrass, and Kentucky bluegrass are common types of grass in Chula Vista that release pollen. Grass pollen is usually at its peak from late spring to early summer.
In late summer and fall, weed pollen becomes the primary concern. Ragweed, sagebrush, and Russian thistle are common in Chula Vista and can cause significant allergy symptoms. These plants are especially prolific in releasing their microscopic particles into the air during the dry season, leading to an increase in hay fever symptoms.
Living in Chula Vista, you can enjoy a beautiful and diverse natural landscape. However, this diversity in plant life also contributes to varying pollen levels throughout the year. Understanding the types of pollen and their seasonal cycles can help residents prepare for and manage their hay fever symptoms, even without mentioning any specific treatments or remedies. This knowledge empowers individuals to make informed decisions about their daily activities, enabling them to fully enjoy the natural beauty of Chula Vista all year round.