Fullerton, CA Pollen and Allergy Report for Summer 2023

Pollen Allergy Trends in Fullerton, CA
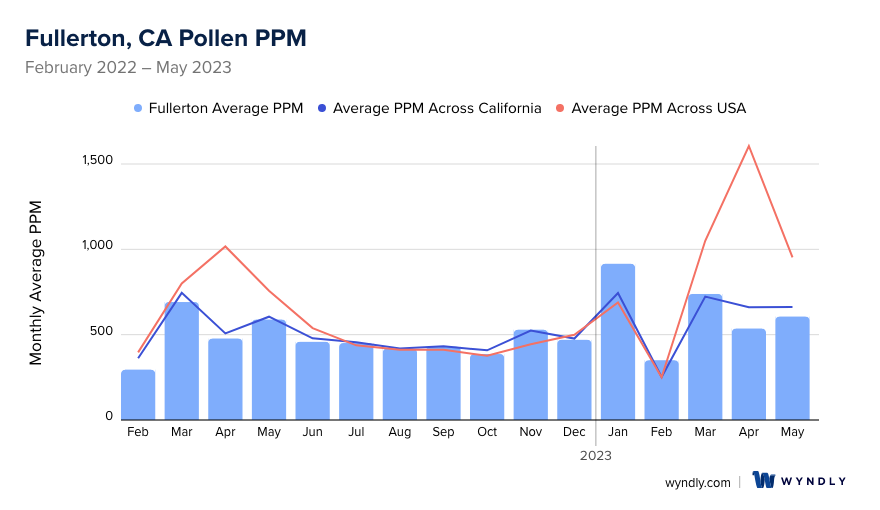
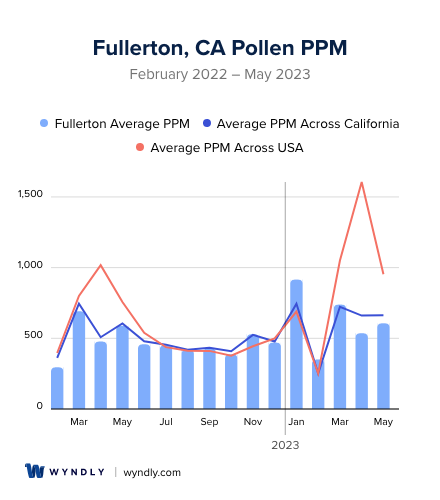
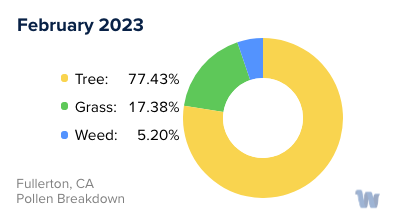
When is pollen lowest in Fullerton, CA?
February
Lowest month total PPM
Avg. PPM
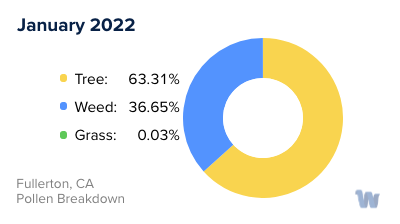
When is pollen highest in Fullerton, CA?
January
Highest month total PPM
Avg. PPM
How does pollen in Fullerton, CA compare to California?
Fullerton has a lower average PPM than the state of California.
Fullerton yearly avg PPM:
California yearly avg PPM:
How does pollen in Fullerton, CA compare to the USA?
Fullerton has a lower average PPM than the USA.
Fullerton yearly avg PPM:
USA yearly avg PPM:
Is pollen worse this year in Fullerton, CA?
Spring 2023 was worse than spring 2022.
Spring 2023 PPM:
Spring 2022 PPM:
Average PPM in Fullerton, CA
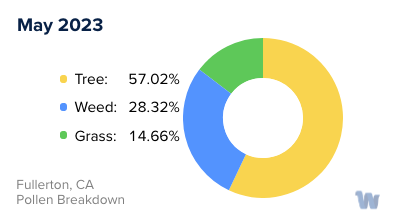
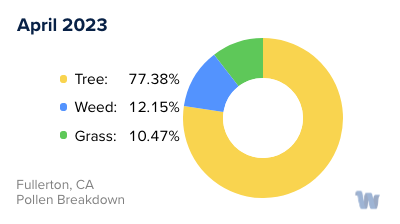
Fullerton, CA Pollen and Allergy Breakdown by Month
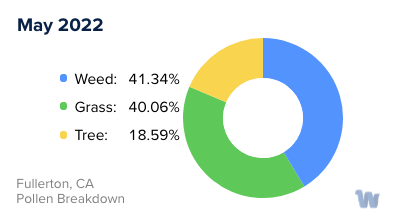
Grass
When is grass pollen highest in Fullerton, CA?
May has the highest grass pollen in Fullerton, CA with an average PPM of
When is grass pollen lowest in Fullerton, CA?
December has the lowest grass pollen in Fullerton, CA with an average PPM of
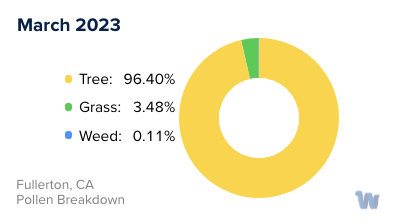
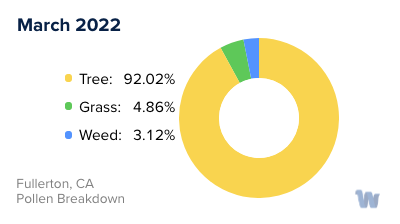
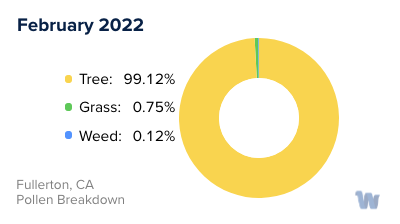
Tree
When is tree pollen highest in Fullerton, CA?
March has the highest tree pollen in Fullerton, CA with an average PPM of
When is tree pollen lowest in Fullerton, CA?
August has the lowest tree pollen in Fullerton, CA with an average PPM of
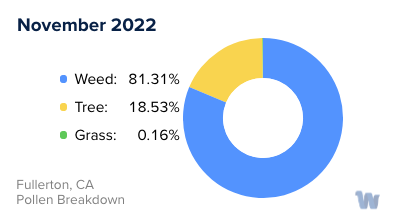
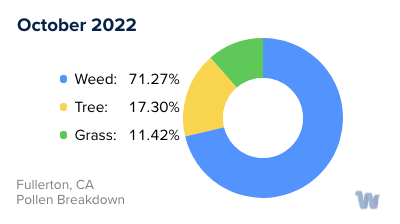
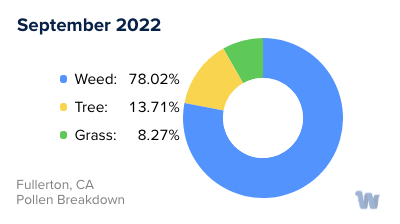
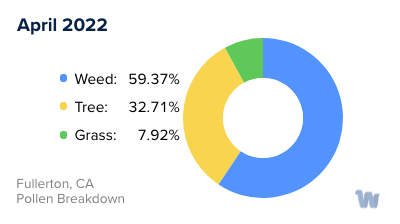
Weed
When is weed pollen highest in Fullerton, CA?
November has the highest weed pollen in Fullerton, CA with an average PPM of
When is weed pollen lowest in Fullerton, CA?
February has the lowest weed pollen in Fullerton, CA with an average PPM of
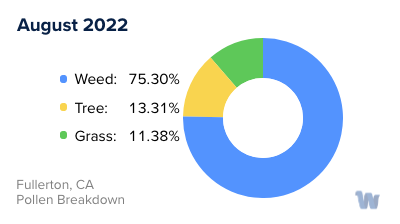
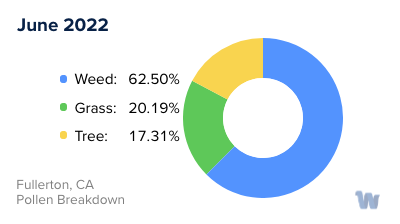
Fullerton, CA Pollen Monthly Breakdown by Pollen Type


Pollen and Hay Fever in Fullerton, CA
For residents of Fullerton, California, the changing seasons bring with them a varying array of pollens, each with their potential to trigger hay fever and other allergic reactions. Understanding the types of pollens and when they're most prevalent can be instrumental in managing symptoms and planning outdoor activities.
In Fullerton, one of the key sources of pollen comes from trees. Tree pollen is usually most prominent in the spring, with Willow and Pine trees being common culprits. These trees release tiny, lightweight pollen grains that can be carried by the wind over great distances, and they can easily find their way into a susceptible person's respiratory system.
As spring transitions into summer, grass pollens start to dominate. These pollens are smaller and less visible than tree pollens, but they are equally capable of causing allergic reactions. When the grass is cut or otherwise disturbed, it can release pollen into the air, where it can be inhaled or come into contact with your skin or eyes.
Finally, as summer gives way to fall, weed pollens become more prevalent. These are produced by a variety of different weeds and can be especially problematic for allergy sufferers. Like tree and grass pollens, weed pollens are designed to be carried by the wind, making them a common cause of hay fever.
It's worth noting that the exact timing and severity of each pollen season can vary from year to year, depending on factors such as temperature, rainfall, and daylight hours. This means that individuals with pollen allergies may experience different symptoms at different times each year.
In conclusion, Fullerton, California, like many places, experiences a cyclical parade of pollens from trees, grasses, and weeds. Each season brings its unique set of challenges for those with allergies, and staying informed can help you navigate these changes more comfortably.