Tuscaloosa, AL Pollen and Allergy Report for Summer 2023

Pollen Allergy Trends in Tuscaloosa, AL

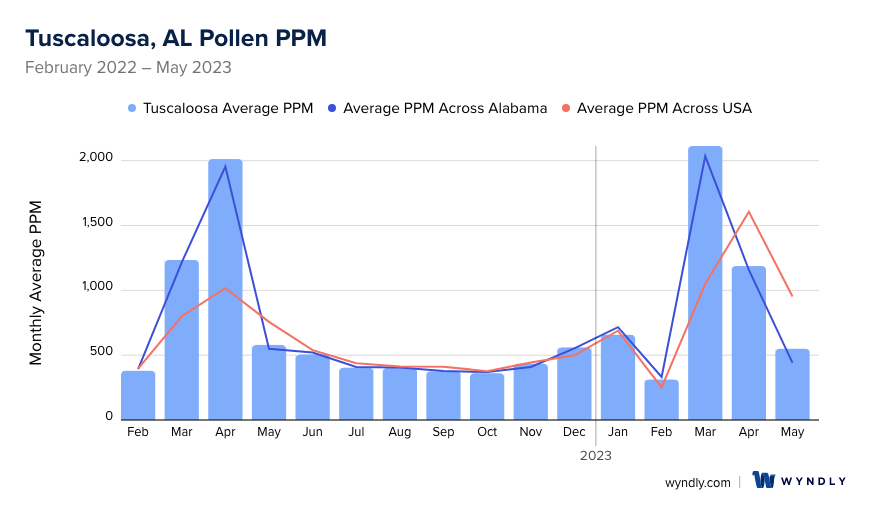
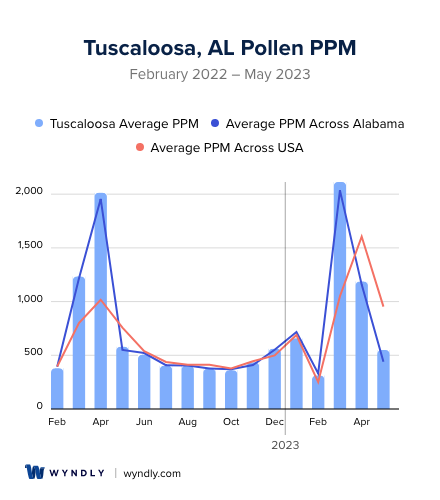
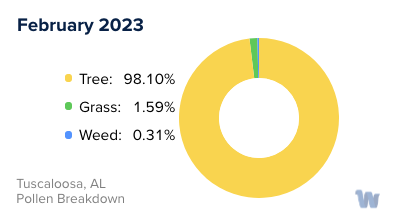
When is pollen lowest in Tuscaloosa, AL?

Green down arrow

February

Lowest month total PPM

311.71 Avg. PPM

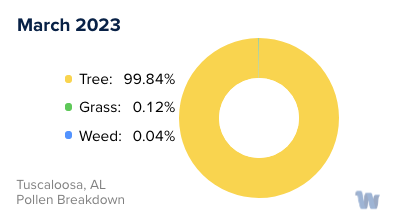
When is pollen highest in Tuscaloosa, AL?

Red up arrow

March

Highest month total PPM

2,113.27 Avg. PPM

How does pollen in Tuscaloosa, AL compare to Alabama?

Tuscaloosa has a higher average PPM than the state of Alabama.

Tuscaloosa yearly avg PPM: 754.13

Alabama yearly avg PPM: 739.81

How does pollen in Tuscaloosa, AL compare to the USA?

Tuscaloosa has a higher average PPM than the USA.

Tuscaloosa yearly avg PPM: 754.13

USA yearly avg PPM: 664.86

Is pollen worse this year in Tuscaloosa, AL?

Spring 2023 was about the same as 2022.

Spring 2023 PPM: 3,849.79

Spring 2022 PPM: 3,826.1

Average PPM in Tuscaloosa, AL

Tuscaloosa, AL Average PPM Tuscaloosa, AL Average PPM

Tuscaloosa, AL Pollen and Allergy Breakdown by Month

Grass

When is grass pollen highest in Tuscaloosa, AL?

April has the highest grass pollen in Tuscaloosa, AL with an average PPM of 706.88

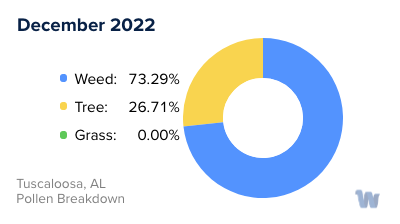
When is grass pollen lowest in Tuscaloosa, AL?

December has the lowest grass pollen in Tuscaloosa, AL with an average PPM of 0

Tree

When is tree pollen highest in Tuscaloosa, AL?

March has the highest tree pollen in Tuscaloosa, AL with an average PPM of 2,109.88

When is tree pollen lowest in Tuscaloosa, AL?

September has the lowest tree pollen in Tuscaloosa, AL with an average PPM of 51.15

Weed

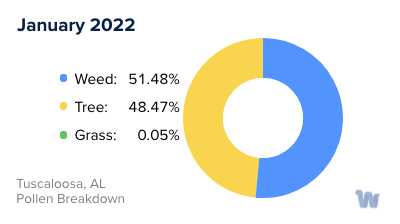
When is weed pollen highest in Tuscaloosa, AL?

April has the highest weed pollen in Tuscaloosa, AL with an average PPM of 429.2

When is weed pollen lowest in Tuscaloosa, AL?

February has the lowest weed pollen in Tuscaloosa, AL with an average PPM of 0.08

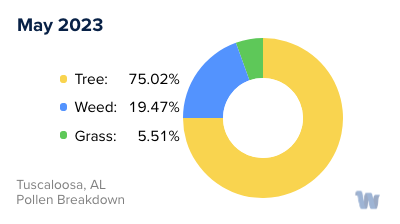
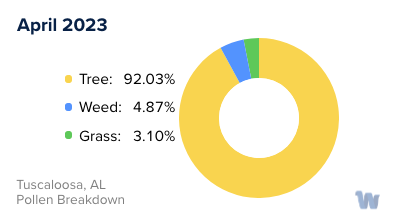
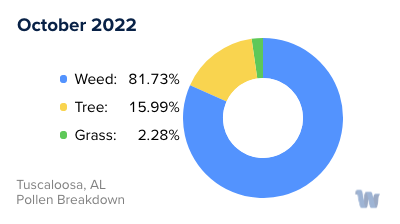
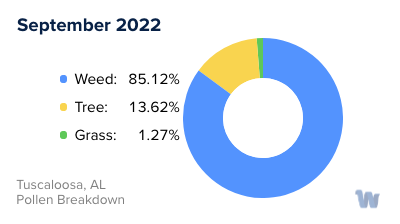
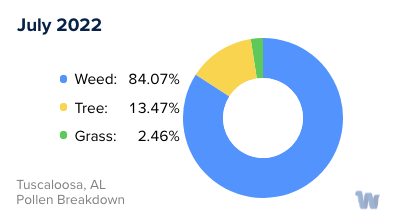
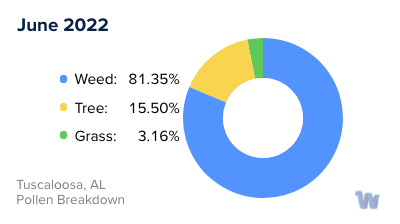
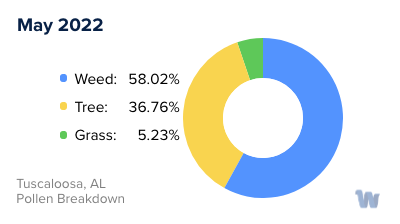
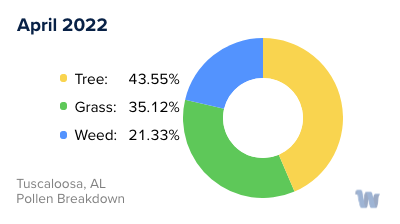
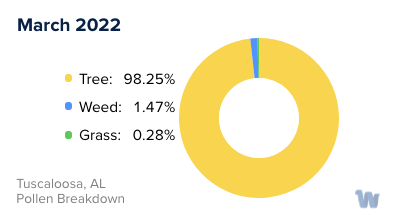
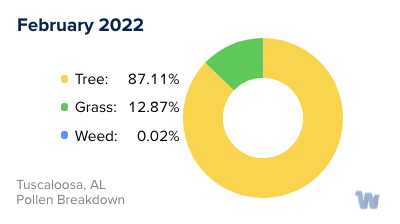
Tuscaloosa, AL Pollen Monthly Breakdown by Pollen Type

Tuscaloosa, AL Monthly Pollen Breakdown

Pollen and Hay Fever in Tuscaloosa, AL

In Tuscaloosa, Alabama, the beauty of the changing seasons comes with a downside for many residents: pollen allergies. Commonly known as hay fever, pollen allergies occur when the immune system reacts to pollen grains in the air. As the seasons transition, various plants release these tiny particles to fertilize other plants. This natural process is essential for plant reproduction, but for allergy sufferers, it can cause a cascade of symptoms like sneezing, itchy eyes, and a runny nose.

In Tuscaloosa, there are three primary types of pollen that are the culprits behind hay fever: tree pollen, grass pollen, and weed pollen. Each type has its peak season, making pollen allergies a year-round concern for some individuals.

Tree pollen is most prevalent in the spring. As trees awaken from their winter slumber, they release copious amounts of pollen into the air. Oak, pine, and cedar are some of the common trees in Tuscaloosa whose pollen can trigger allergies.

As spring gives way to summer, grass pollen takes center stage. Bermuda grass, bahia grass, and Kentucky bluegrass are common in Tuscaloosa, and their pollen levels surge during the late spring and early summer months.

Lastly, weed pollen becomes prominent as summer transitions into fall. Ragweed is a prime offender in Tuscaloosa, releasing pollen from late summer to mid-fall.

In Tuscaloosa, it's essential to be aware of the types of pollen and their respective seasons. By understanding when certain pollens are prevalent, residents can better anticipate and manage their allergy symptoms without compromising their enjoyment of the city’s natural beauty.

Tuscaloosa, AL Map

What is Wyndly?

Wyndly is the easiest and most convenient way to fix your allergies forever. As an online allergy practice, Wyndly offers at-home allergy testing and treatment. The main goal of Wyndly is to retrain the immune system to stop responding to allergens, providing lasting relief from allergies.

Here's how Wyndly works:

  1. Identify Allergy Triggers: The first step is to identify the allergy triggers. You can purchase an at-home allergy test from Wyndly, or if you have already done an allergy test elsewhere, you can share your existing test results. This allows the doctors at Wyndly to pinpoint which allergies need to be treated.
  2. Get Treated by a Real Doctor: Using medications that are similar to those used in allergy shots, a doctor creates a unique sublingual immunotherapy treatment plan to desensitize your immune system. This is done using FDA-approved sublingual tablets or clinically proven dosing for oral use.
  3. Live Better Without Symptoms: The prescriptions are shipped to your door, and the doctor works with you until you’re better. Wyndly offers regular online check-ins with US-licensed physicians and 24/7 availability for questions or concerns via text, email, or call.

The treatment plans are personalized based on your specific allergy triggers and aim to treat allergies at their source, rather than just relieving symptoms for a short period. Most people report improvement in as little as one month.

Start with Wyndly today

Wyndly Summer 2023 Pollen Report Methodology

For each city, Wyndly obtained monthly pollen PPMs (pollen grains per cubic meter) for each form (tree, grass, and weed) from February 2022 - May 2023. Data were obtained from Pollen Sense, LLC Automated Particulate Sensors (APS). These sensors automatically detect particulate matter collected from ambient air, and use a neural network algorithm to identify individual pollen species and calculate daily pollen counts.

Yearly averages are calculated by summing the three allergen averages per month of data for a total monthly PPM, summing all monthly total PPMs, then dividing by 12 (month count). Used for per-city average, state average, and total USA average. Season comparisons are done by summing the months of Spring (March, April, May) for 2023 and 2022. If the absolute of the (2023-2022)/2022 is ≤ 0.05, the years were about the same. Otherwise, the more PPM, the worse the season was.

Is Wyndly right for you?

Answer just a few questions and we'll help you find out.

Get Started Today

Pollen and Allergy Reports by City