Tucson, AZ Pollen and Allergy Report for Summer 2023

Pollen Allergy Trends in Tucson, AZ

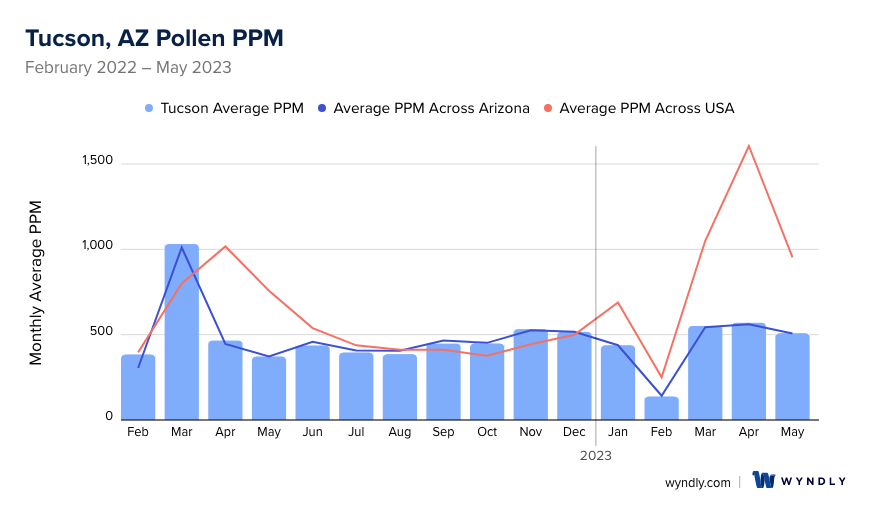
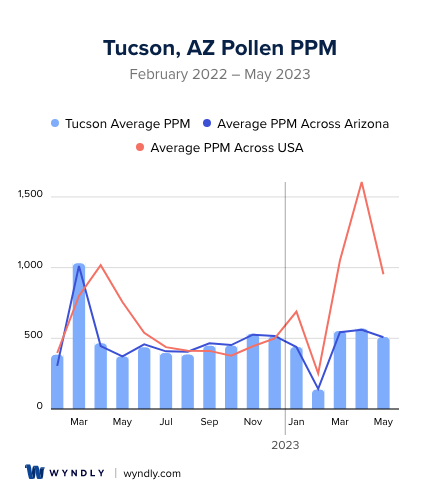
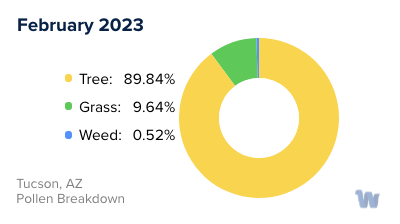
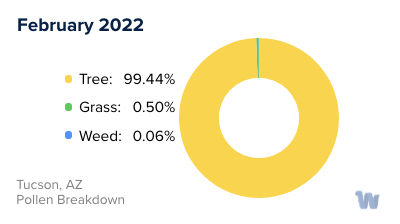
When is pollen lowest in Tucson, AZ?

Green down arrow

February

Lowest month total PPM

137.93 Avg. PPM

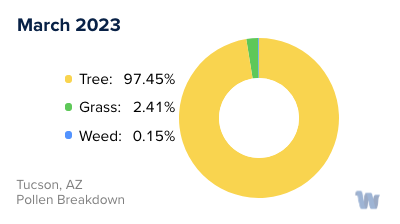
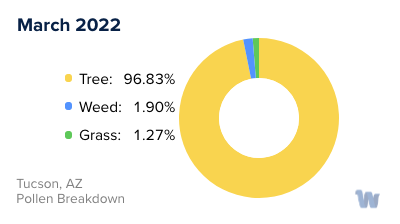
When is pollen highest in Tucson, AZ?

Red up arrow

March

Highest month total PPM

1,031.16 Avg. PPM

How does pollen in Tucson, AZ compare to Arizona?

Tucson has a higher average PPM than the state of Arizona.

Tucson yearly avg PPM: 476.42

Arizona yearly avg PPM: 472.29

How does pollen in Tucson, AZ compare to the USA?

Tucson has a lower average PPM than the USA.

Tucson yearly avg PPM: 476.42

USA yearly avg PPM: 664.86

Is pollen worse this year in Tucson, AZ?

Spring 2023 was better than spring 2022.

Spring 2023 PPM: 1,629.49

Spring 2022 PPM: 1,868.97

Average PPM in Tucson, AZ

Tucson, AZ Average PPM Tucson, AZ Average PPM

Tucson, AZ Pollen and Allergy Breakdown by Month
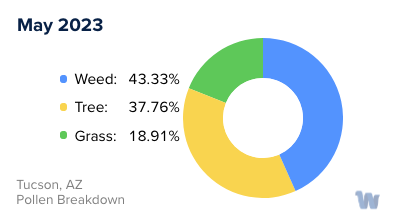
Grass

When is grass pollen highest in Tucson, AZ?

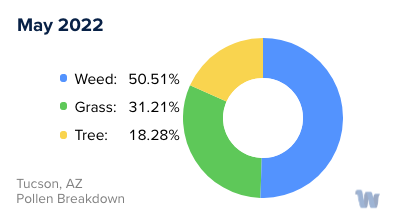
May has the highest grass pollen in Tucson, AZ with an average PPM of 116.2

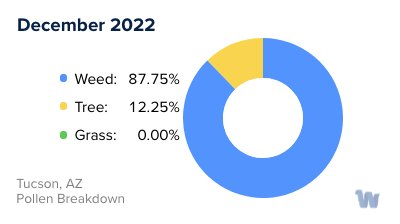
When is grass pollen lowest in Tucson, AZ?

December has the lowest grass pollen in Tucson, AZ with an average PPM of
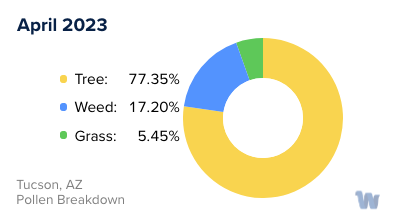
 0

Tree

When is tree pollen highest in Tucson, AZ?

March has the highest tree pollen in Tucson, AZ with an average PPM of 998.5

When is tree pollen lowest in Tucson, AZ?

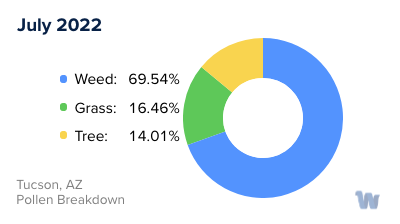
July has the lowest tree pollen in Tucson, AZ with an average PPM of 55.44

Weed

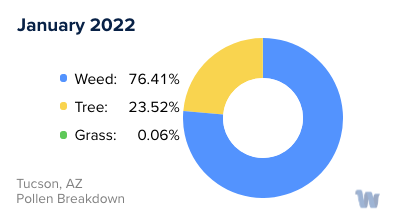
When is weed pollen highest in Tucson, AZ?

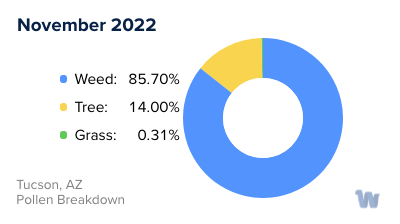
November has the highest weed pollen in Tucson, AZ with an average PPM of 456.34

When is weed pollen lowest in Tucson, AZ?

February has the lowest weed pollen in Tucson, AZ with an average PPM of 0.24

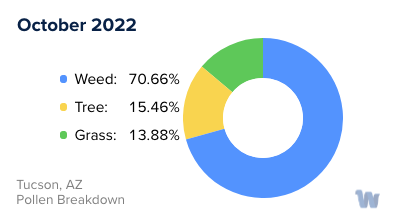
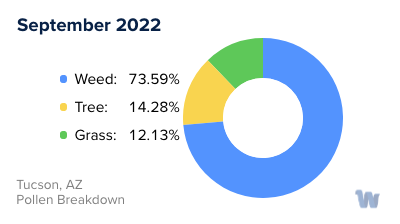
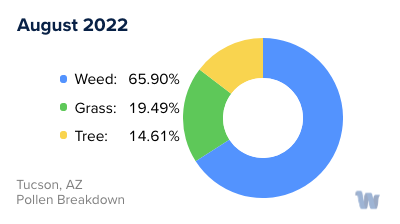
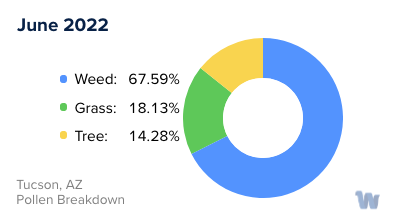
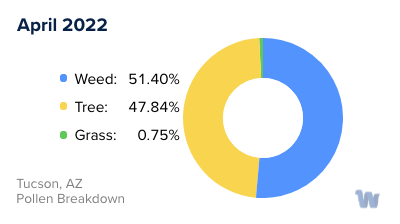
Tucson, AZ Pollen Monthly Breakdown by Pollen Type

Tucson, AZ Monthly Pollen Breakdown

Pollen and Hay Fever in Tucson, AZ

In the sun-kissed city of Tucson, Arizona, residents and visitors alike can revel in the stunning desert landscapes. However, for those with pollen allergies, Tucson's unique flora can be a double-edged sword.

Pollen allergies, often referred to as hay fever, are a common ailment in Tucson. Hay fever is essentially an allergic reaction to pollen, a powdery substance released by plants for fertilization. This reaction can cause a plethora of symptoms such as sneezing, a runny nose, and itchy eyes.

In Tucson, there are several types of pollen that are particularly prevalent. One of the major contributors to pollen allergies in the area is the mesquite tree. Mesquite trees are abundant in Tucson and release their pollen primarily in the late spring and early summer. Another significant source of pollen is the palo verde tree, which typically pollinates in the spring. This tree’s bright yellow flowers are not just a feast for the eyes but also a cause of sneezing for many.

Moreover, grasses such as Bermuda grass release pollen mainly during the late spring and early summer, contributing to the pollen count. During the monsoon season, which generally runs from July through September, the moisture can cause an increase in mold spores, which, although not pollen, can exacerbate hay fever symptoms for some individuals.

It's also worth mentioning that desert ragweed, which is common in the Tucson area, releases its pollen in the late summer and fall. This plant is notorious for causing allergic reactions and is a significant source of hay fever symptoms.

Being aware of the types of pollen and the seasons in which they are most prevalent in Tucson is key to understanding and managing pollen allergies in this beautiful desert city.

Tucson, AZ Map

What is Wyndly?

Wyndly is the easiest and most convenient way to fix your allergies forever. As an online allergy practice, Wyndly offers at-home allergy testing and treatment. The main goal of Wyndly is to retrain the immune system to stop responding to allergens, providing lasting relief from allergies.

Here's how Wyndly works:

  1. Identify Allergy Triggers: The first step is to identify the allergy triggers. You can purchase an at-home allergy test from Wyndly, or if you have already done an allergy test elsewhere, you can share your existing test results. This allows the doctors at Wyndly to pinpoint which allergies need to be treated.
  2. Get Treated by a Real Doctor: Using medications that are similar to those used in allergy shots, a doctor creates a unique sublingual immunotherapy treatment plan to desensitize your immune system. This is done using FDA-approved sublingual tablets or clinically proven dosing for oral use.
  3. Live Better Without Symptoms: The prescriptions are shipped to your door, and the doctor works with you until you’re better. Wyndly offers regular online check-ins with US-licensed physicians and 24/7 availability for questions or concerns via text, email, or call.

The treatment plans are personalized based on your specific allergy triggers and aim to treat allergies at their source, rather than just relieving symptoms for a short period. Most people report improvement in as little as one month.

Start with Wyndly today

Wyndly Summer 2023 Pollen Report Methodology

For each city, Wyndly obtained monthly pollen PPMs (pollen grains per cubic meter) for each form (tree, grass, and weed) from February 2022 - May 2023. Data were obtained from Pollen Sense, LLC Automated Particulate Sensors (APS). These sensors automatically detect particulate matter collected from ambient air, and use a neural network algorithm to identify individual pollen species and calculate daily pollen counts.

Yearly averages are calculated by summing the three allergen averages per month of data for a total monthly PPM, summing all monthly total PPMs, then dividing by 12 (month count). Used for per-city average, state average, and total USA average. Season comparisons are done by summing the months of Spring (March, April, May) for 2023 and 2022. If the absolute of the (2023-2022)/2022 is ≤ 0.05, the years were about the same. Otherwise, the more PPM, the worse the season was.

Is Wyndly right for you?

Answer just a few questions and we'll help you find out.

Get Started Today

Pollen and Allergy Reports by City