Pomona, CA Pollen and Allergy Report for Summer 2023

Pollen Allergy Trends in Pomona, CA
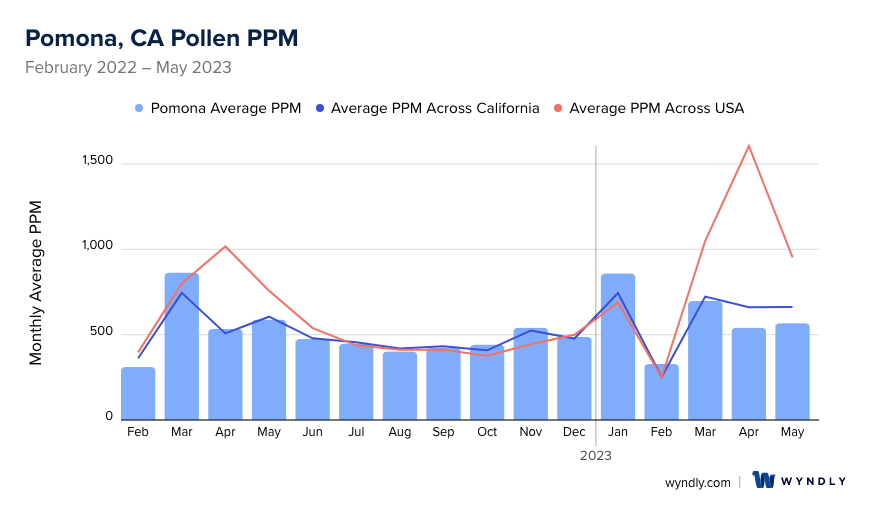
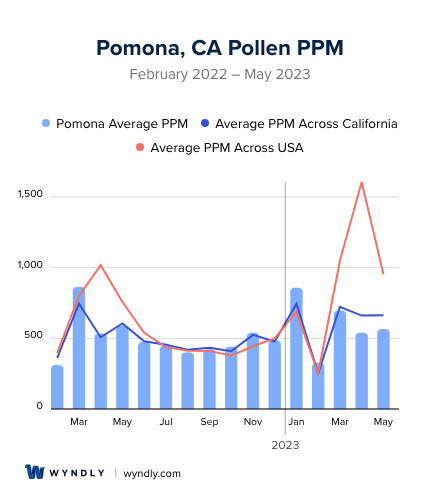
When is pollen lowest in Pomona, CA?
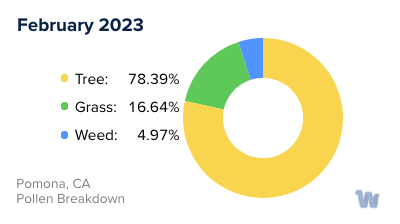
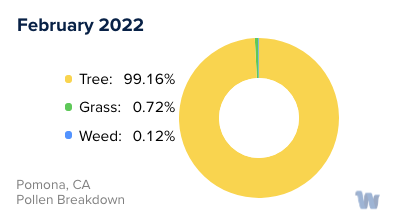
February
Lowest month total PPM
Avg. PPM
When is pollen highest in Pomona, CA?
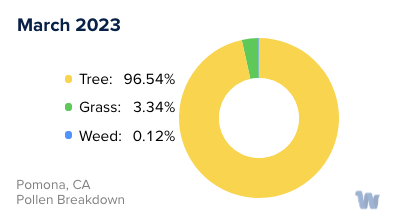
March
Highest month total PPM
Avg. PPM
How does pollen in Pomona, CA compare to California?
Pomona has a higher average PPM than the state of California.
Pomona yearly avg PPM:
California yearly avg PPM:
How does pollen in Pomona, CA compare to the USA?
Pomona has a lower average PPM than the USA.
Pomona yearly avg PPM:
USA yearly avg PPM:
Is pollen worse this year in Pomona, CA?
Spring 2023 was better than spring 2022.
Spring 2023 PPM:
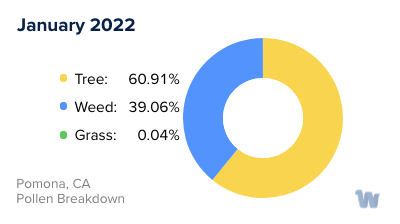
Spring 2022 PPM:
Average PPM in Pomona, CA
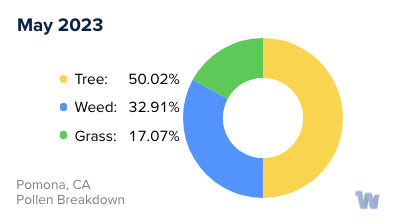
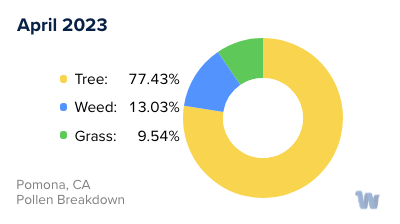
Pomona, CA Pollen and Allergy Breakdown by Month
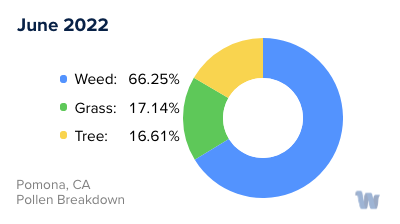
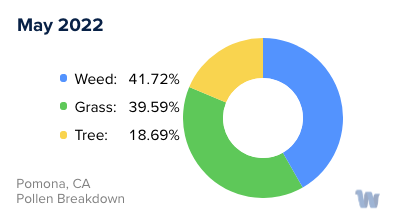
Grass
When is grass pollen highest in Pomona, CA?
May has the highest grass pollen in Pomona, CA with an average PPM of
When is grass pollen lowest in Pomona, CA?
December has the lowest grass pollen in Pomona, CA with an average PPM of
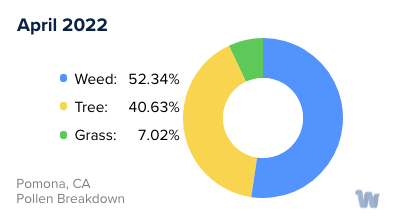
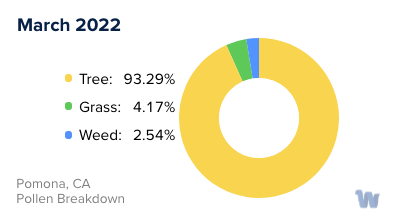
Tree
When is tree pollen highest in Pomona, CA?
March has the highest tree pollen in Pomona, CA with an average PPM of
When is tree pollen lowest in Pomona, CA?
August has the lowest tree pollen in Pomona, CA with an average PPM of
Weed
When is weed pollen highest in Pomona, CA?
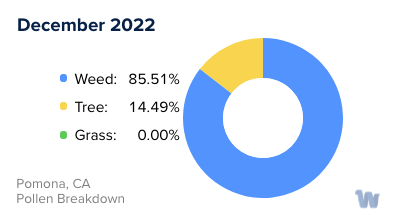
November has the highest weed pollen in Pomona, CA with an average PPM of
When is weed pollen lowest in Pomona, CA?
February has the lowest weed pollen in Pomona, CA with an average PPM of
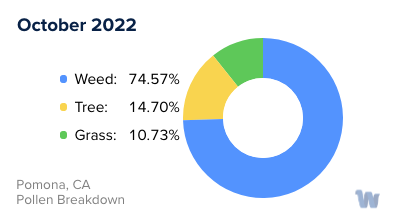
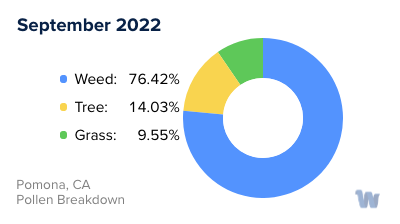
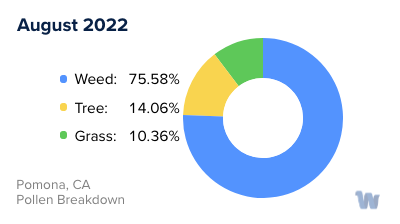
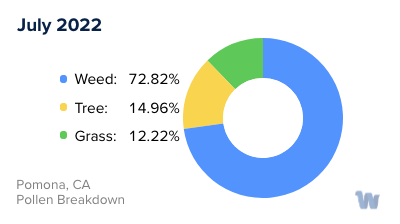
Pomona, CA Pollen Monthly Breakdown by Pollen Type

Pollen and Hay Fever in Pomona, CA
In Pomona, California, as in the rest of the state, the climate is warm throughout the year. However, the coastal nature of California's climate makes pollen counts generally lower than in other states with similar weather conditions. Despite this, there are still many seasonal allergies affecting the residents.
Seasonal allergies are often triggered by pollen, which is released by plants during certain times of the year. In California, the main contributors of pollen are grasses, trees, and weeds. Pollen allergies tend to flare up during the spring, summer, and fall, with indoor allergies such as dust, pet dander, and mold causing allergic reactions year-round.
The allergy season in California typically begins in late January and ends in early October. California’s milder winter allows the allergy season to start earlier than in many other states. This means a longer allergy season, but thanks to the state's climate, it can be more manageable for allergy sufferers.
April, May, and September are the months where seasonal allergies usually peak. During these months, pollen counts are at their highest, so it is advisable to monitor them closely. In the evenings, pollen counts are generally lower, so it can be more comfortable to go outside during these times.
Some of the common types of pollen that cause allergies in California include Bluegrass, Ryegrass, Sagebrush, Ragweed, Russian thistle, Mulberry, Oak, Olive, Ash, Cedar, and Eucalyptus.
As the season transitions into winter, which is milder in California, seasonal allergies tend to diminish. However, indoor allergens can still cause problems, especially if more time is spent indoors.
In summary, residents of Pomona and the broader California region face a lengthy allergy season primarily caused by various types of pollen from grasses, trees, and weeds. Being informed and cautious, especially during peak months, is essential for managing these allergies.