San Mateo, CA Pollen and Allergy Report for Summer 2023

Pollen Allergy Trends in San Mateo, CA
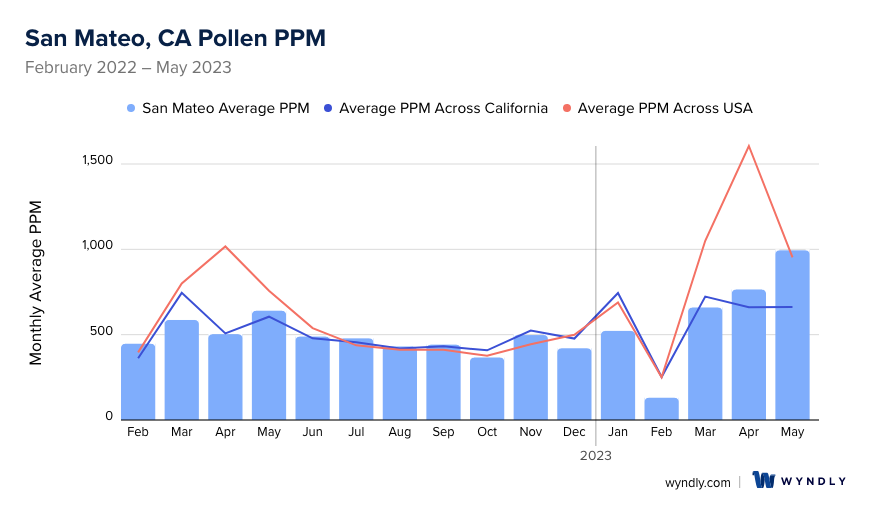
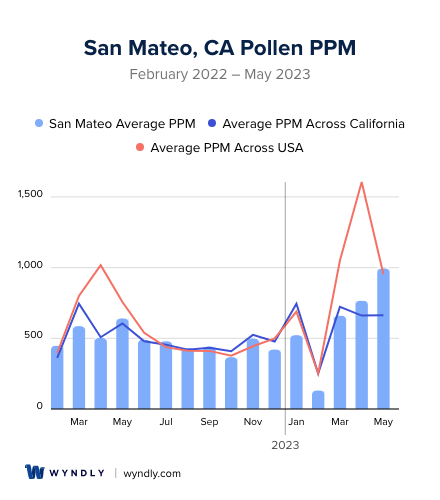
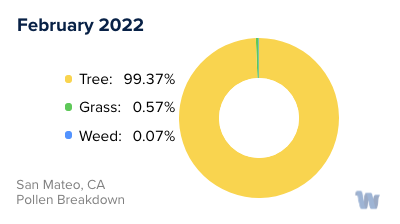
When is pollen lowest in San Mateo, CA?
February
Lowest month total PPM
Avg. PPM
When is pollen highest in San Mateo, CA?
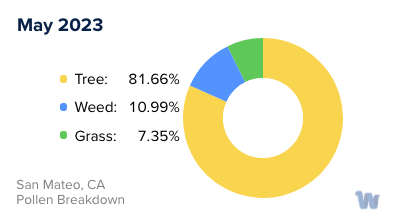
May
Highest month total PPM
Avg. PPM
How does pollen in San Mateo, CA compare to California?
San Mateo has a lower average PPM than the state of California.
San Mateo yearly avg PPM:
California yearly avg PPM:
How does pollen in San Mateo, CA compare to the USA?
San Mateo has a lower average PPM than the USA.
San Mateo yearly avg PPM:
USA yearly avg PPM:
Is pollen worse this year in San Mateo, CA?
Spring 2023 was worse than spring 2022.
Spring 2023 PPM:
Spring 2022 PPM:
Average PPM in San Mateo, CA
San Mateo, CA Pollen and Allergy Breakdown by Month
Grass
When is grass pollen highest in San Mateo, CA?
May has the highest grass pollen in San Mateo, CA with an average PPM of
When is grass pollen lowest in San Mateo, CA?
December has the lowest grass pollen in San Mateo, CA with an average PPM of
Tree
When is tree pollen highest in San Mateo, CA?
May has the highest tree pollen in San Mateo, CA with an average PPM of
When is tree pollen lowest in San Mateo, CA?
August has the lowest tree pollen in San Mateo, CA with an average PPM of
Weed
When is weed pollen highest in San Mateo, CA?
November has the highest weed pollen in San Mateo, CA with an average PPM of
When is weed pollen lowest in San Mateo, CA?
February has the lowest weed pollen in San Mateo, CA with an average PPM of
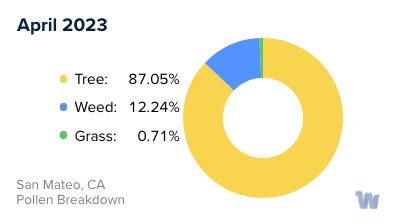
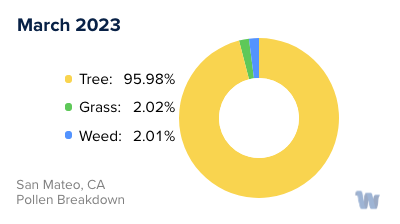
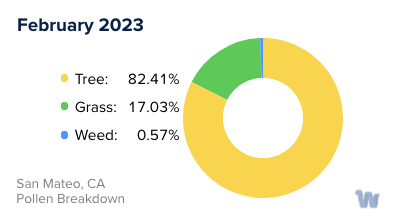
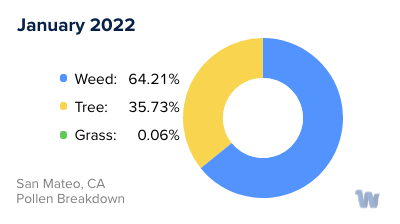
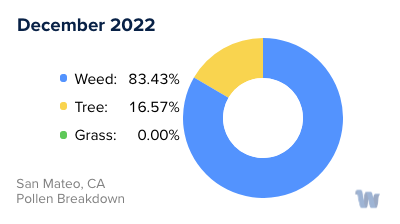
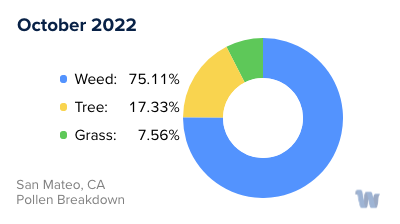
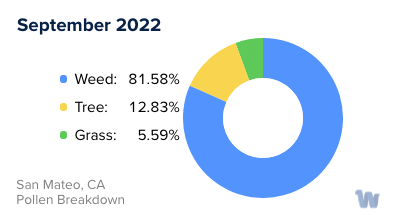
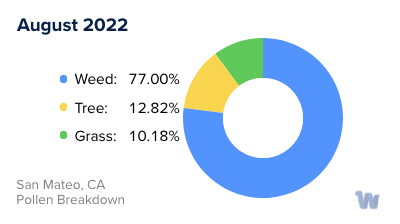
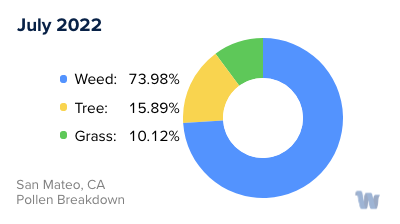
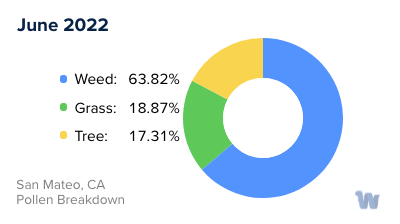
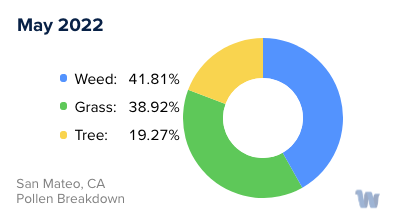
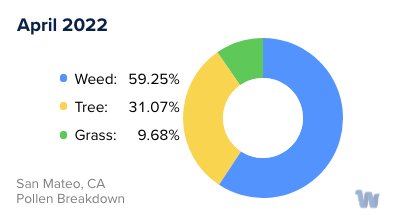
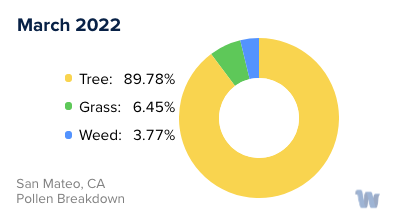
San Mateo, CA Pollen Monthly Breakdown by Pollen Type

Pollen and Hay Fever in San Mateo, CA
Pollen allergies, commonly known as hay fever, are a significant concern for many residents of San Mateo, California. This bustling city, nestled within the larger San Francisco Bay Area, sees a variety of plant species bloom throughout the year, each releasing their own unique pollen that can trigger an allergic response in susceptible individuals.
Pollen is a fine powder produced by flowering plants for reproduction. In San Mateo, the primary sources of allergy-inducing pollen come from trees, grasses, and weeds. Each of these plant types follow distinct blooming periods, meaning the pollen 'season' changes throughout the year.
Starting the year, tree pollen is the foremost concern. The city's diverse urban forest, which includes oak, pine, cedar, and walnut trees, begin to release their pollen as early as January, with levels peaking around March and April. This means springtime in San Mateo can often lead to the onset of hay fever symptoms like sneezing, runny nose, and itchy, watery eyes.
As spring transitions into summer, grass pollen takes the lead. Common grasses in the area, such as ryegrass and Bermuda grass, typically have their pollination period from May to July. This means that residents can experience a shift in their allergy symptoms as the dominant pollen type changes.
Come late summer and fall, weed pollen, especially from plants like ragweed and sagebrush, becomes more prevalent. These plants usually pollinate from August to November, extending the pollen season into the later months of the year.
The pollen levels in San Mateo can be influenced by several factors, including the weather, time of day, and the local vegetation. Warm, windy days are particularly conducive to high pollen counts as the wind can carry the pollen for miles, increasing exposure.
In conclusion, understanding the timing and sources of pollen in San Mateo can help residents anticipate and manage their hay fever symptoms. It's important to remember, however, that individual reactions to pollen can vary widely, and what affects one person strongly may not impact another at all.