Santa Clarita, CA Pollen and Allergy Report for Summer 2023

Pollen Allergy Trends in Santa Clarita, CA
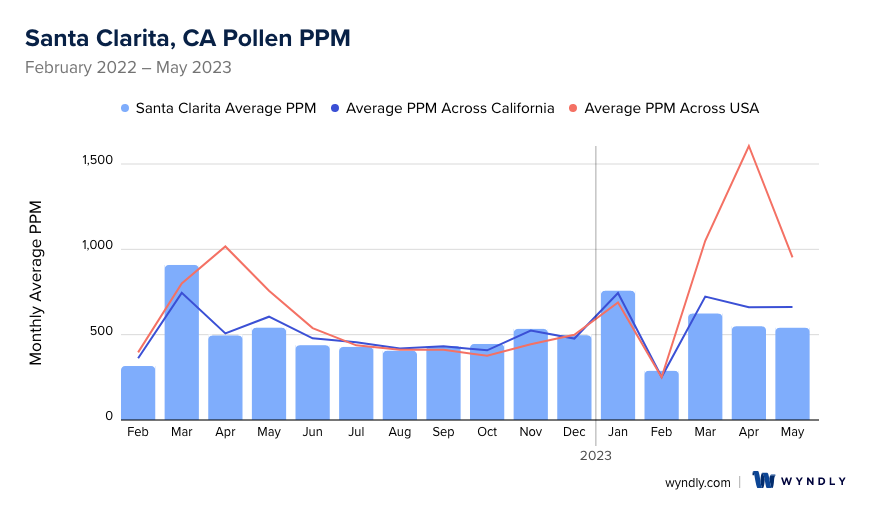
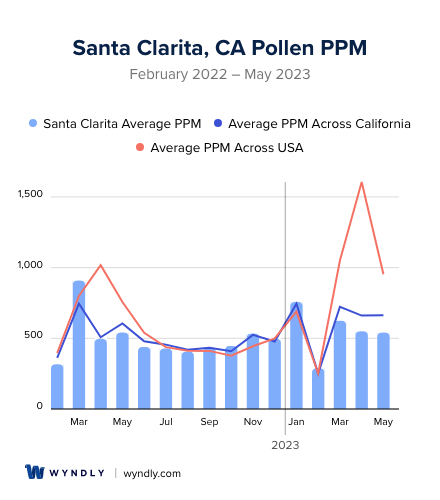
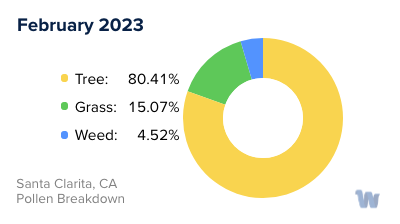
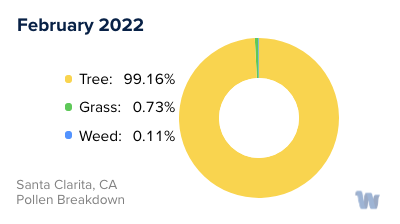
When is pollen lowest in Santa Clarita, CA?
February
Lowest month total PPM
Avg. PPM
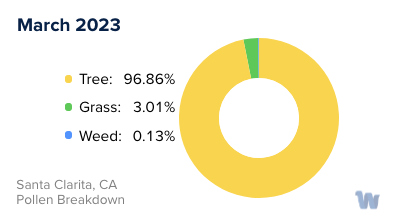
When is pollen highest in Santa Clarita, CA?
March
Highest month total PPM
Avg. PPM
How does pollen in Santa Clarita, CA compare to California?
Santa Clarita has a lower average PPM than the state of California.
Santa Clarita yearly avg PPM:
California yearly avg PPM:
How does pollen in Santa Clarita, CA compare to the USA?
Santa Clarita has a lower average PPM than the USA.
Santa Clarita yearly avg PPM:
USA yearly avg PPM:
Is pollen worse this year in Santa Clarita, CA?
Spring 2023 was better than spring 2022.
Spring 2023 PPM:
Spring 2022 PPM:
Average PPM in Santa Clarita, CA
Santa Clarita, CA Pollen and Allergy Breakdown by Month
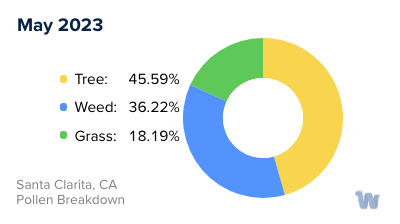
Grass
When is grass pollen highest in Santa Clarita, CA?
May has the highest grass pollen in Santa Clarita, CA with an average PPM of
When is grass pollen lowest in Santa Clarita, CA?
December has the lowest grass pollen in Santa Clarita, CA with an average PPM of
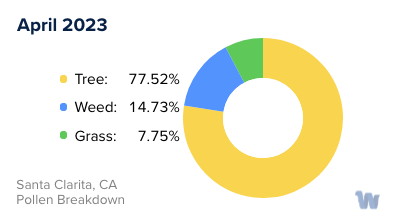
Tree
When is tree pollen highest in Santa Clarita, CA?
March has the highest tree pollen in Santa Clarita, CA with an average PPM of
When is tree pollen lowest in Santa Clarita, CA?
August has the lowest tree pollen in Santa Clarita, CA with an average PPM of
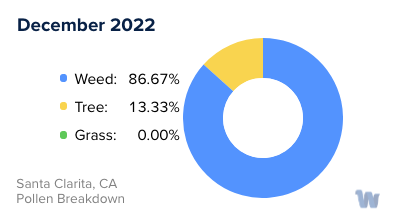
Weed
When is weed pollen highest in Santa Clarita, CA?
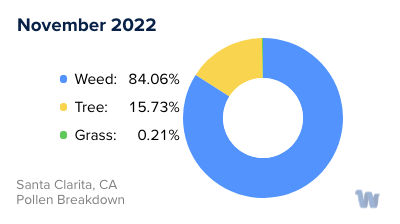
November has the highest weed pollen in Santa Clarita, CA with an average PPM of
When is weed pollen lowest in Santa Clarita, CA?
February has the lowest weed pollen in Santa Clarita, CA with an average PPM of
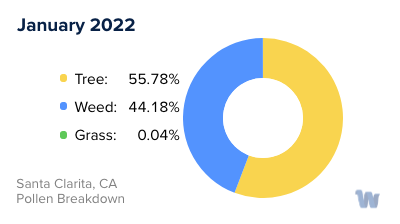
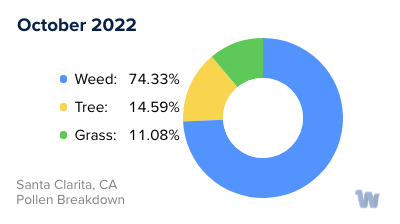
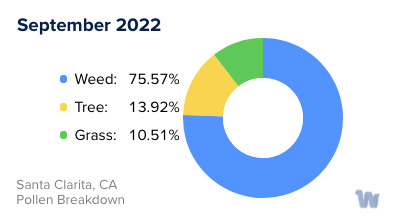
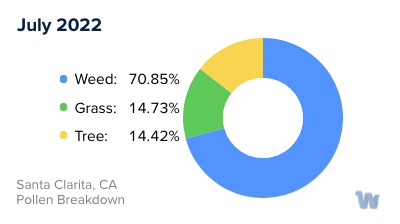
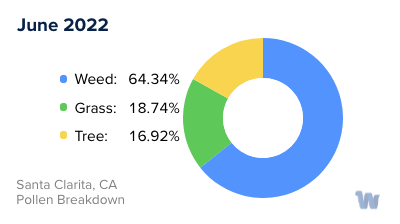
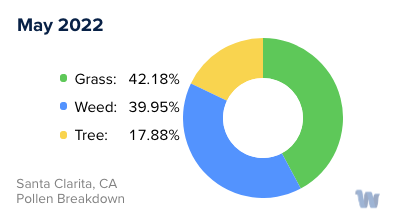
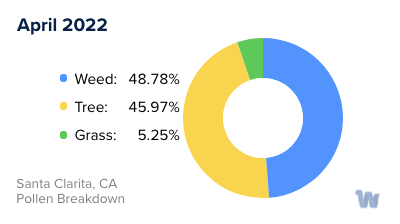
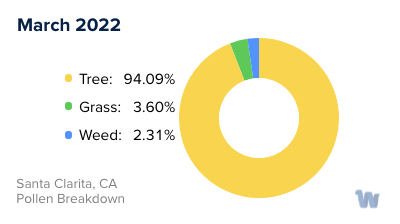
Santa Clarita, CA Pollen Monthly Breakdown by Pollen Type

Pollen and Hay Fever in Santa Clarita, CA
Pollen allergies, often known as hay fever, are a common occurrence in Santa Clarita, California. The city's diverse flora triggers allergic reactions in susceptible individuals, particularly during specific times of the year when pollen counts are high. Understanding the types of pollen and the seasons when they peak can be instrumental in managing your daily activities.
Among the many plant species in Santa Clarita, three prominent ones contribute significantly to pollen allergies: grasses, trees, and weeds. Each has its own distinct pollen season, contributing to a nearly year-round pollen cycle.
Grasses are among the leading causes of pollen allergies. In Santa Clarita, common grasses such as Bermuda grass, Kentucky bluegrass, and Timothy grass start releasing their pollen in late spring and continue through early summer.
Trees are another significant source of allergenic pollen. Oak, cedar, and pine trees begin their pollination in late winter and continue into spring. These trees are abundant in Santa Clarita, adding to the high pollen counts during this period.
Lastly, weeds also contribute to the pollen count. Ragweed and sagebrush are two common types of weeds in Santa Clarita that release pollen. Weed pollen season typically starts in late summer and extends into fall, sometimes persisting until the first frost.
Santa Clarita's mild climate allows for an extended pollen season, often leading to high pollen counts for much of the year. Remember that the specific timing of these pollen seasons can vary slightly from year to year, depending on factors like rainfall, temperature, and daylight hours. While these allergenic pollens can't be avoided entirely, understanding when they're most prevalent can help those susceptible to allergies anticipate and navigate the pollen seasons in Santa Clarita, California.