Simi Valley, CA Pollen and Allergy Report for Summer 2023

Pollen Allergy Trends in Simi Valley, CA
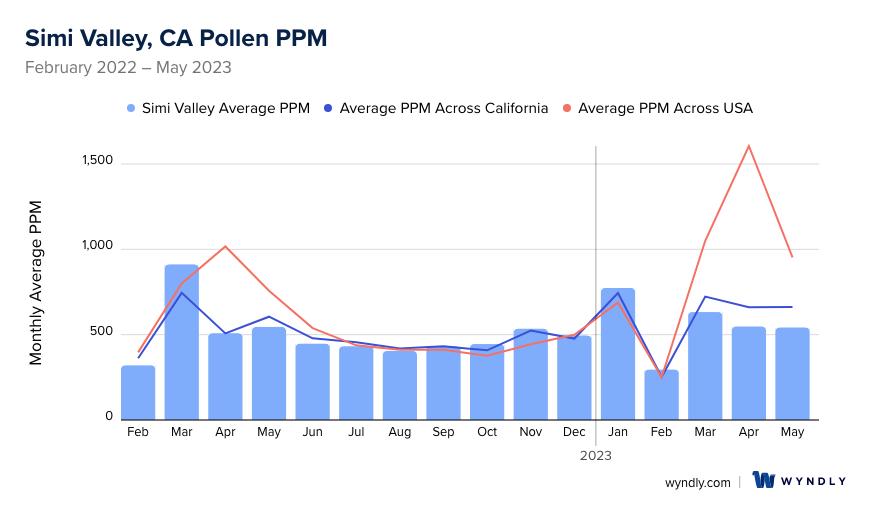
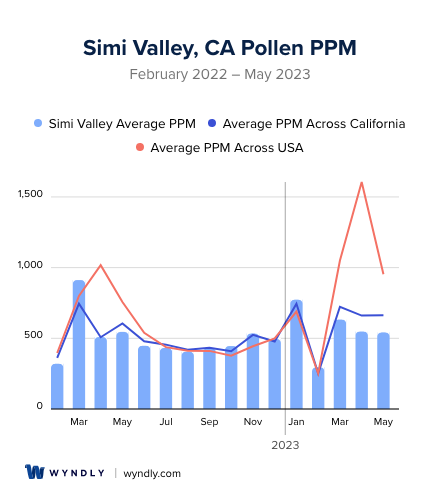
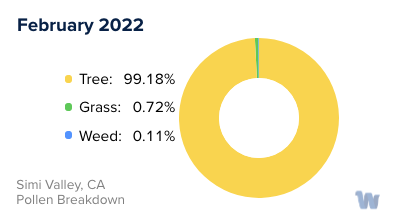
When is pollen lowest in Simi Valley, CA?
February
Lowest month total PPM
Avg. PPM
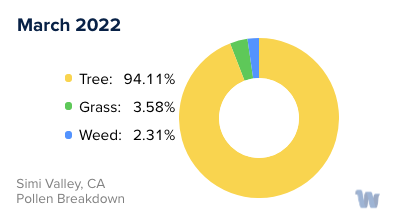
When is pollen highest in Simi Valley, CA?
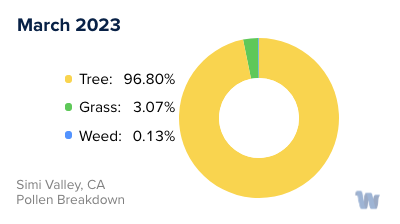
March
Highest month total PPM
Avg. PPM
How does pollen in Simi Valley, CA compare to California?
Simi Valley has a lower average PPM than the state of California.
Simi Valley yearly avg PPM:
California yearly avg PPM:
How does pollen in Simi Valley, CA compare to the USA?
Simi Valley has a lower average PPM than the USA.
Simi Valley yearly avg PPM:
USA yearly avg PPM:
Is pollen worse this year in Simi Valley, CA?
Spring 2023 was better than spring 2022.
Spring 2023 PPM:
Spring 2022 PPM:
Average PPM in Simi Valley, CA
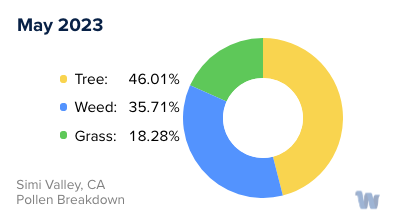
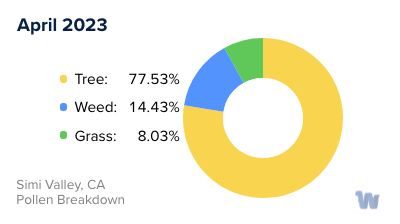
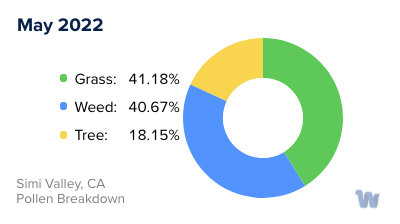
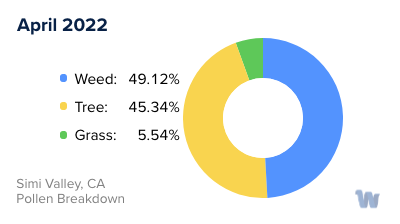
Simi Valley, CA Pollen and Allergy Breakdown by Month
Grass
When is grass pollen highest in Simi Valley, CA?
May has the highest grass pollen in Simi Valley, CA with an average PPM of
When is grass pollen lowest in Simi Valley, CA?
December has the lowest grass pollen in Simi Valley, CA with an average PPM of
Tree
When is tree pollen highest in Simi Valley, CA?
March has the highest tree pollen in Simi Valley, CA with an average PPM of
When is tree pollen lowest in Simi Valley, CA?
August has the lowest tree pollen in Simi Valley, CA with an average PPM of
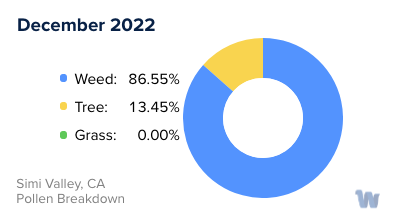
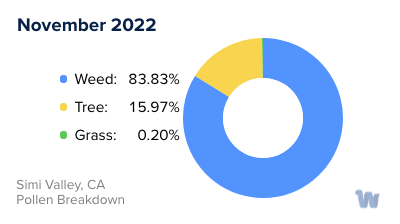
Weed
When is weed pollen highest in Simi Valley, CA?
November has the highest weed pollen in Simi Valley, CA with an average PPM of
When is weed pollen lowest in Simi Valley, CA?
February has the lowest weed pollen in Simi Valley, CA with an average PPM of
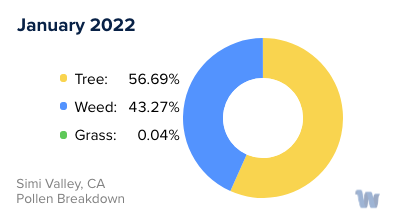
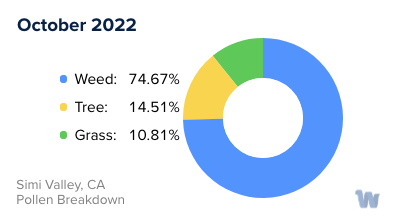
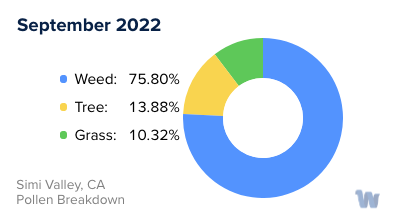
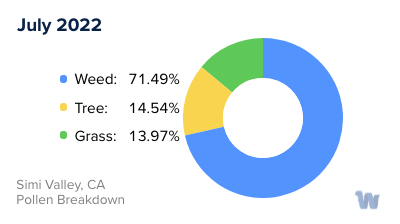
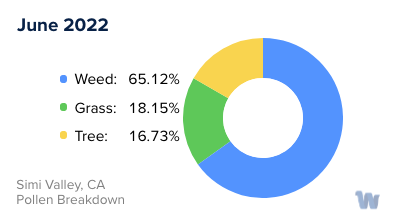
Simi Valley, CA Pollen Monthly Breakdown by Pollen Type


Pollen and Hay Fever in Simi Valley, CA
Pollen allergies, also known as hay fever, are a prevalent health concern in Simi Valley, California. These allergies occur when your immune system reacts to pollen, a tiny, often microscopic substance released by plants for fertilization. Your body's response can lead to a variety of symptoms like sneezing, runny nose, and itchy eyes, which, although not life-threatening, can affect your daily comfort and productivity.
In Simi Valley, the primary sources of pollen are trees, grasses, and weeds, each of which peak in different seasons. Tree pollen is typically the first to arrive, peaking in the late winter to early spring. The primary contributors include oak, cedar, pine, and walnut trees, each releasing vast amounts of pollen that can be carried by the wind for miles.
Following tree pollen season, grass pollen takes the stage in late spring and early summer. Bermuda grass, ryegrass, and Timothy grass are common in Simi Valley and are major sources of this type of pollen. These grasses are often used in lawns and public spaces, making it hard to avoid exposure during this time.
Lastly, weed pollen emerges in late summer and continues into the fall. The primary culprits are ragweed, sagebrush, and Russian thistle. These plants are drought-tolerant and thrive in Simi Valley's arid climate, releasing large quantities of lightweight pollen that can travel long distances.
Living in Simi Valley means dealing with a nearly year-round pollen season due to the region's diverse plant life and favorable climate. From the late winter months with the tree pollens through to the fall with the various weed pollens, residents are subjected to a continuous cycle of potential allergenic exposure. Understanding the types of pollen and their respective seasons can be the first step in managing your comfort and well-being throughout the year in this beautiful Californian city.