Temecula, CA Pollen and Allergy Report for Summer 2023

Pollen Allergy Trends in Temecula, CA
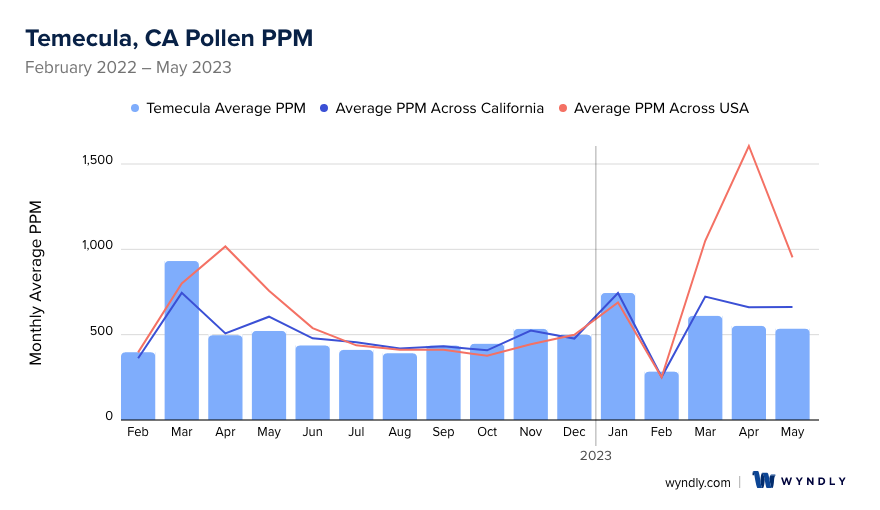
When is pollen lowest in Temecula, CA?
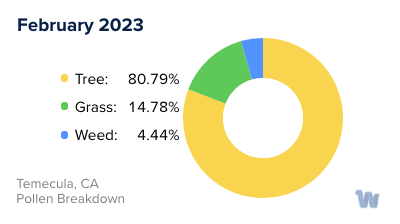
February
Lowest month total PPM
Avg. PPM
When is pollen highest in Temecula, CA?
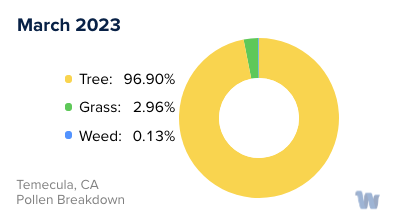
March
Highest month total PPM
Avg. PPM
How does pollen in Temecula, CA compare to California?
Temecula has a lower average PPM than the state of California.
Temecula yearly avg PPM:
California yearly avg PPM:
How does pollen in Temecula, CA compare to the USA?
Temecula has a lower average PPM than the USA.
Temecula yearly avg PPM:
USA yearly avg PPM:
Is pollen worse this year in Temecula, CA?
Spring 2023 was better than spring 2022.
Spring 2023 PPM:
Spring 2022 PPM:
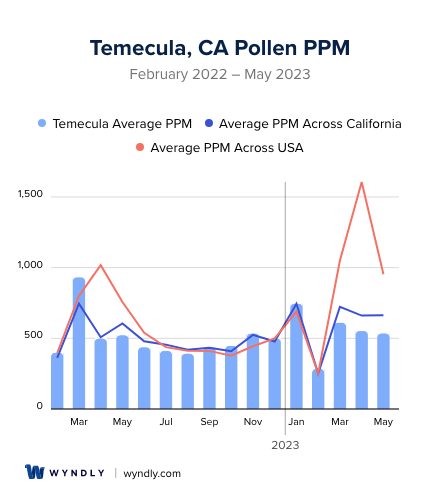
Average PPM in Temecula, CA
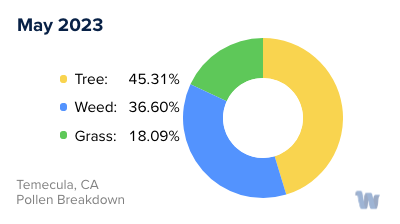
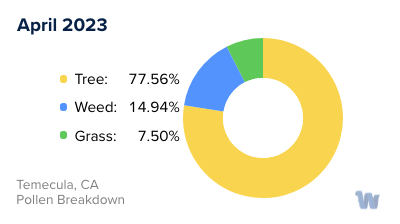
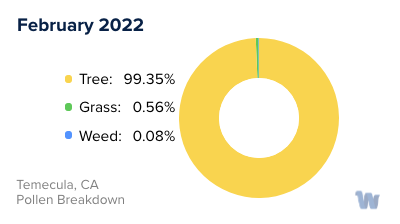
Temecula, CA Pollen and Allergy Breakdown by Month
Grass
When is grass pollen highest in Temecula, CA?
May has the highest grass pollen in Temecula, CA with an average PPM of
When is grass pollen lowest in Temecula, CA?
December has the lowest grass pollen in Temecula, CA with an average PPM of
Tree
When is tree pollen highest in Temecula, CA?
March has the highest tree pollen in Temecula, CA with an average PPM of
When is tree pollen lowest in Temecula, CA?
July has the lowest tree pollen in Temecula, CA with an average PPM of
Weed
When is weed pollen highest in Temecula, CA?
November has the highest weed pollen in Temecula, CA with an average PPM of
When is weed pollen lowest in Temecula, CA?
February has the lowest weed pollen in Temecula, CA with an average PPM of
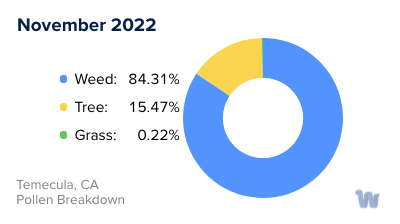
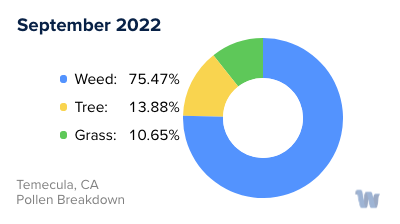
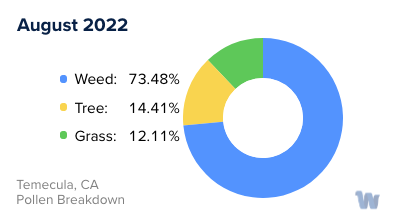
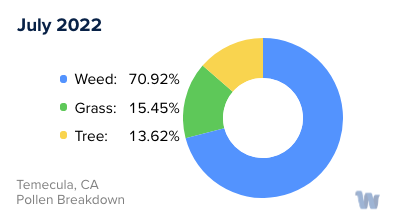
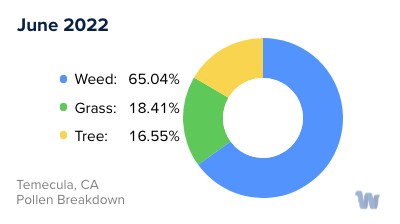
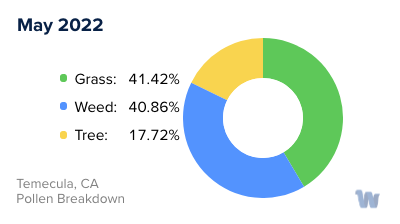
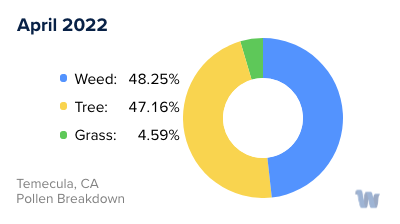
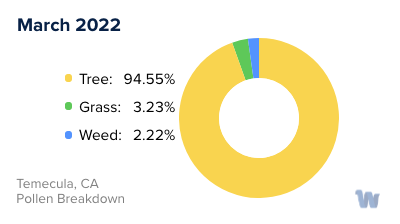
Temecula, CA Pollen Monthly Breakdown by Pollen Type

Pollen and Hay Fever in Temecula, CA
In the picturesque city of Temecula, California, nestled amongst rolling hills and vineyards, residents and visitors may encounter a common health concern: pollen allergies, often referred to as hay fever. This condition is particularly prevalent during specific seasons when various plants are in bloom.
Spring heralds the beginning of the pollen season in Temecula. Trees, such as oaks, pines, and cottonwoods, begin to release their pollen into the air. The lightweight nature of tree pollen allows it to be carried by the wind, which means it can easily find its way into sensitive noses and eyes, causing discomfort.
As we transition into summer, the focus shifts to grass pollen. The bountiful grassy areas and parks of Temecula become a source of allergens, as grasses including Bermuda, Timothy, and Kentucky bluegrass release their pollen. This is the time when many people experience the classic symptoms of hay fever, such as sneezing, itchy eyes, and a runny nose.
Moving on to the fall season, the culprits behind pollen allergies change once again. This time, it is the weeds that take center stage. Ragweed is a significant offender, but other weeds such as sagebrush and tumbleweed also contribute to the pollen count. As Temecula is located in an area with a mix of natural vegetation and agriculture, weed pollen can be quite prominent during autumn.
It’s important to note that in Temecula, like in many parts of Southern California, the mild winters do not necessarily provide a complete respite from pollen. Some trees and plants may still be active, releasing pollen even during the cooler months.
Understanding the types of pollen and the seasons in which they are most prevalent is essential for residents and visitors of Temecula to anticipate and recognize the triggers of their pollen allergies. Being informed can help individuals to navigate the changing seasons with grace and comfort.