Torrance, CA Pollen and Allergy Report for Summer 2023

Pollen Allergy Trends in Torrance, CA
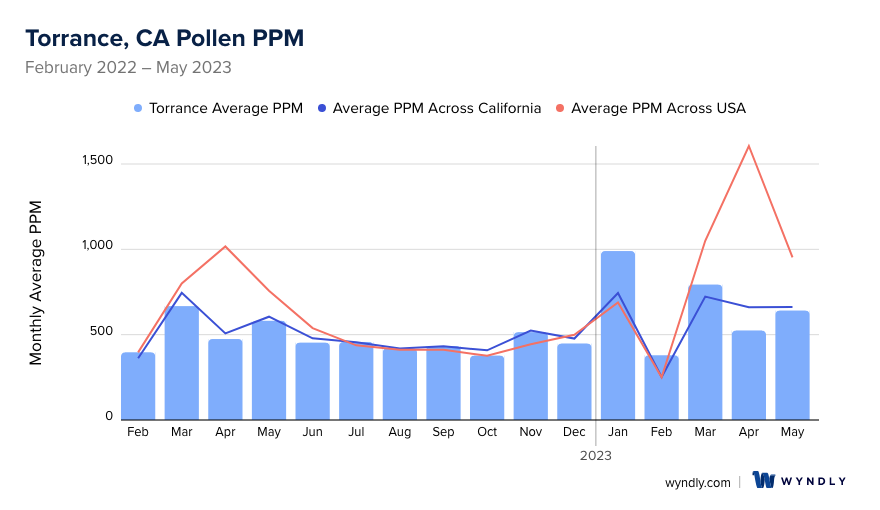
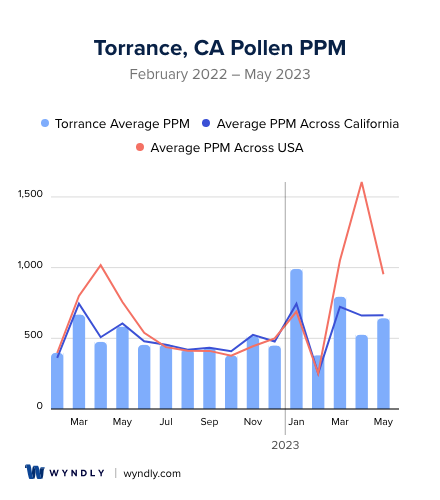
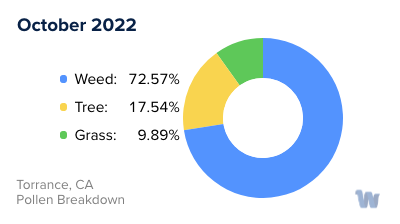
When is pollen lowest in Torrance, CA?
October
Lowest month total PPM
Avg. PPM
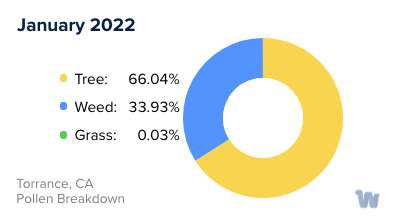
When is pollen highest in Torrance, CA?
January
Highest month total PPM
Avg. PPM
How does pollen in Torrance, CA compare to California?
Torrance has a higher average PPM than the state of California.
Torrance yearly avg PPM:
California yearly avg PPM:
How does pollen in Torrance, CA compare to the USA?
Torrance has a lower average PPM than the USA.
Torrance yearly avg PPM:
USA yearly avg PPM:
Is pollen worse this year in Torrance, CA?
Spring 2023 was worse than spring 2022.
Spring 2023 PPM:
Spring 2022 PPM:
Average PPM in Torrance, CA
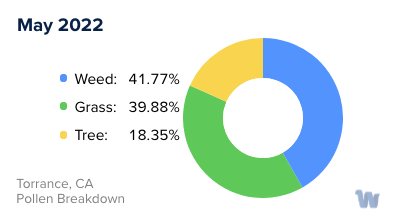
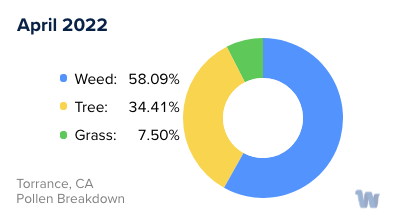
Torrance, CA Pollen and Allergy Breakdown by Month
Grass
When is grass pollen highest in Torrance, CA?
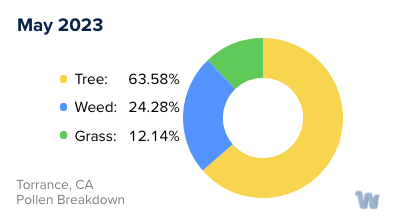
May has the highest grass pollen in Torrance, CA with an average PPM of
When is grass pollen lowest in Torrance, CA?
December has the lowest grass pollen in Torrance, CA with an average PPM of
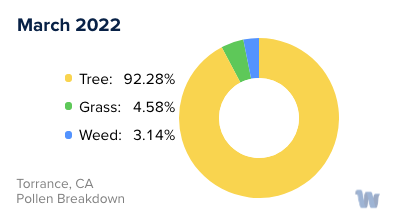
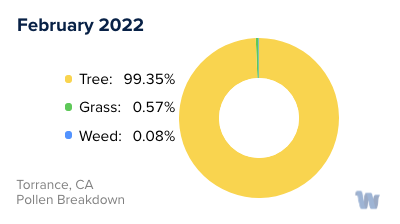
Tree
When is tree pollen highest in Torrance, CA?
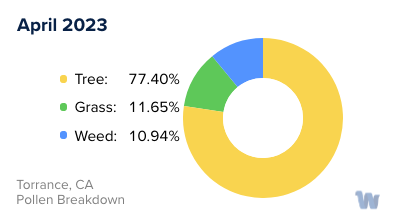
March has the highest tree pollen in Torrance, CA with an average PPM of
When is tree pollen lowest in Torrance, CA?
August has the lowest tree pollen in Torrance, CA with an average PPM of
Weed
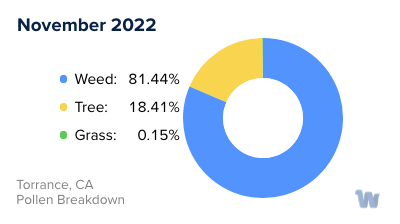
When is weed pollen highest in Torrance, CA?
November has the highest weed pollen in Torrance, CA with an average PPM of
When is weed pollen lowest in Torrance, CA?
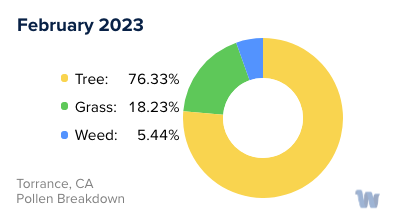
February has the lowest weed pollen in Torrance, CA with an average PPM of
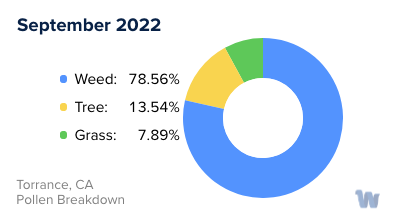
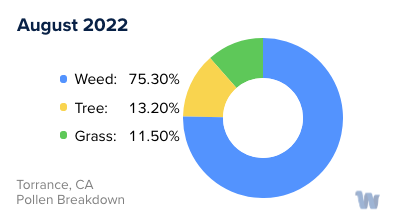
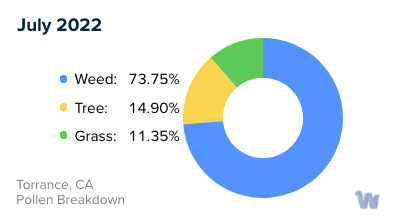
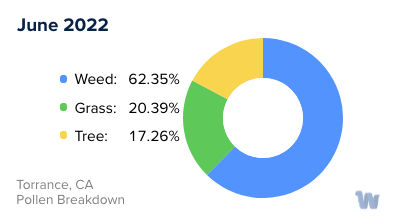
Torrance, CA Pollen Monthly Breakdown by Pollen Type


Pollen and Hay Fever in Torrance, CA
In the picturesque city of Torrance, California, nestled between the rolling Pacific waves and the urban sprawl of Los Angeles, residents and visitors alike often find themselves grappling with pollen allergies. As the seasons transition and the flora flourishes, the air is imbued with microscopic pollen particles, which, though vital for plant reproduction, can cause discomfort for many.
In Torrance, pollen allergies, often referred to as hay fever or allergic rhinitis, are particularly prevalent during the spring and fall. Springtime sees the blooming of trees such as oak, pine, and olive, which release copious amounts of pollen into the air. The vibrant wildflowers that adorn the city’s parks and open spaces also contribute to the increased pollen count.
As the calendar turns to fall, the culprits behind pollen allergies shift to weeds. Ragweed is especially notorious for wreaking havoc on the sinuses of the residents of Torrance. The Santa Ana winds, which are common in Southern California during the fall, can exacerbate the situation by carrying pollen from far-off places, making the air thick with allergens.
It’s not just the outdoors where pollen makes its presence felt. Pollen can easily hitch a ride indoors on clothes, pets, and even the breeze through an open window. This makes it almost inescapable, even for the most reclusive among us.
Being aware of the types of pollen and the seasons in which they are most prevalent can help the citizens of Torrance better understand what they are up against. It also highlights the importance of being mindful of the local environment and its impact on our well-being. Though pollen allergies can be a nuisance, they are also a reminder of the thriving natural beauty that makes Torrance such an enchanting place to live.