Vacaville, CA Pollen and Allergy Report for Summer 2023

Pollen Allergy Trends in Vacaville, CA
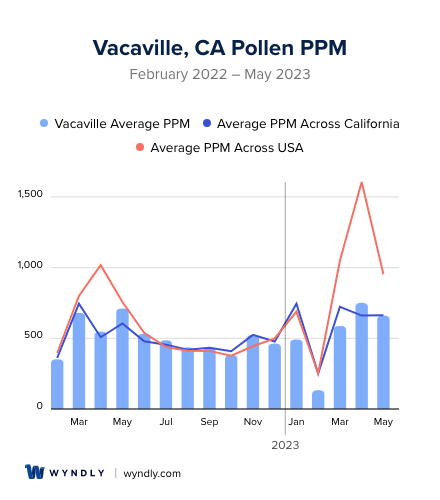
When is pollen lowest in Vacaville, CA?
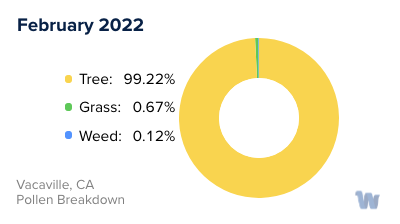
February
Lowest month total PPM
Avg. PPM
When is pollen highest in Vacaville, CA?
April
Highest month total PPM
Avg. PPM
How does pollen in Vacaville, CA compare to California?
Vacaville has a lower average PPM than the state of California.
Vacaville yearly avg PPM:
California yearly avg PPM:
How does pollen in Vacaville, CA compare to the USA?
Vacaville has a lower average PPM than the USA.
Vacaville yearly avg PPM:
USA yearly avg PPM:
Is pollen worse this year in Vacaville, CA?
Spring 2023 was about the same as 2022.
Spring 2023 PPM:
Spring 2022 PPM:
Average PPM in Vacaville, CA

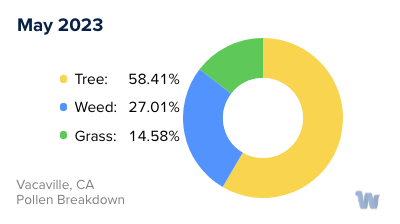
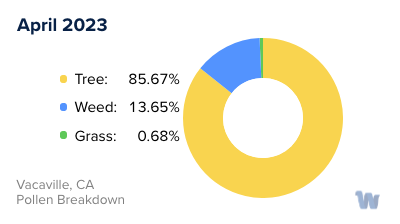
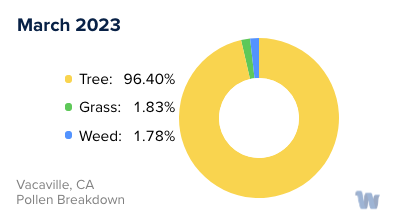
Vacaville, CA Pollen and Allergy Breakdown by Month
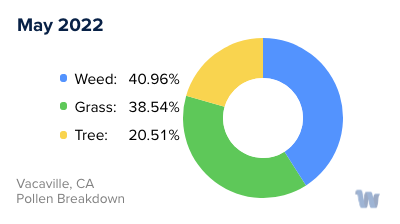
Grass
When is grass pollen highest in Vacaville, CA?
May has the highest grass pollen in Vacaville, CA with an average PPM of
When is grass pollen lowest in Vacaville, CA?
December has the lowest grass pollen in Vacaville, CA with an average PPM of
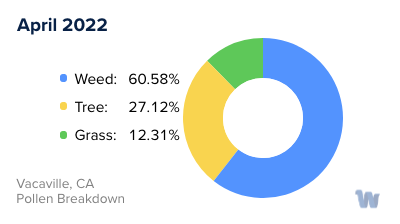
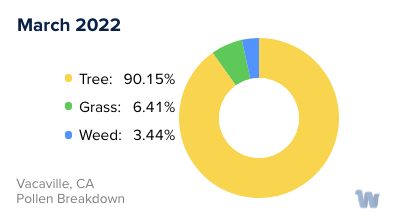
Tree
When is tree pollen highest in Vacaville, CA?
April has the highest tree pollen in Vacaville, CA with an average PPM of
When is tree pollen lowest in Vacaville, CA?
August has the lowest tree pollen in Vacaville, CA with an average PPM of
Weed
When is weed pollen highest in Vacaville, CA?
November has the highest weed pollen in Vacaville, CA with an average PPM of
When is weed pollen lowest in Vacaville, CA?
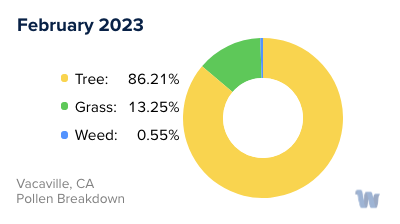
February has the lowest weed pollen in Vacaville, CA with an average PPM of
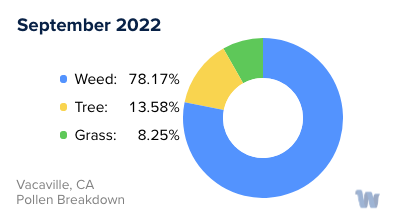
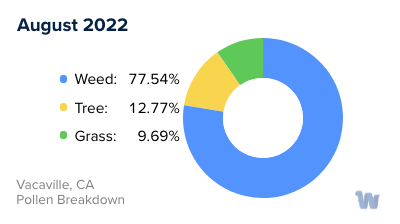
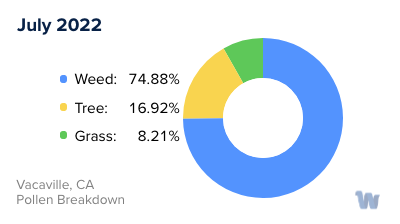
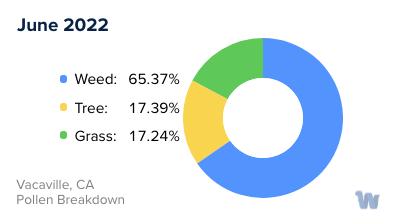
Vacaville, CA Pollen Monthly Breakdown by Pollen Type

Pollen and Hay Fever in Vacaville, CA
In the delightful city of Vacaville, California, residents and visitors alike get to experience the beauty of nature with its vibrant green spaces and blooming flowers. However, for some, this natural splendor can bring about an unwelcome guest: pollen allergies, commonly known as hay fever.
Pollen allergies occur when the immune system overreacts to pollen, a fine powder released by plants for fertilization. Vacaville, situated in Northern California, is surrounded by an array of plant species that contribute to the pollen count.
One of the most prevalent types of pollen in Vacaville comes from grasses. Grass pollen is usually at its peak during late spring and early summer. Bermuda grass, Kentucky bluegrass, and Timothy grass are common culprits that release large amounts of pollen into the air.
Trees also contribute significantly to pollen levels. In Vacaville, oak, pine, and cedar trees are particularly notorious for producing pollen. Tree pollen season generally begins in late winter and extends through spring. This means that as early as February, sensitive individuals may start to notice symptoms of hay fever.
Lastly, the late summer and fall bring the weed pollen season. Weeds such as ragweed, sagebrush, and tumbleweed are common in the area and release pollen that can trigger allergies.
It is important to note that the weather can also play a role in pollen counts. Windy days can lead to more pollen being airborne, while rain can help to wash pollen from the air.
For the residents of Vacaville, being mindful of the types of pollen and their respective seasons can be beneficial in understanding and managing pollen allergies. Being informed empowers individuals to make lifestyle choices that can mitigate exposure to pollen and improve the quality of life during allergy seasons.