Ventura, CA Pollen and Allergy Report for Summer 2023

Pollen Allergy Trends in Ventura, CA

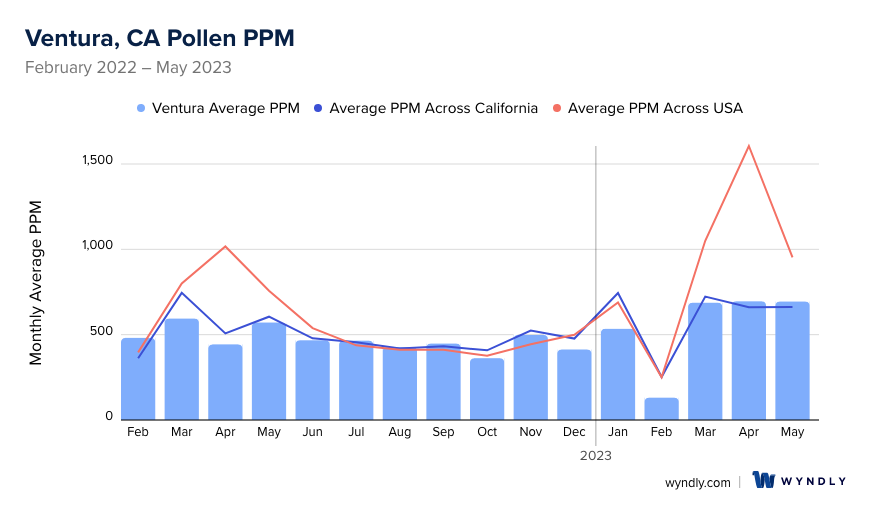
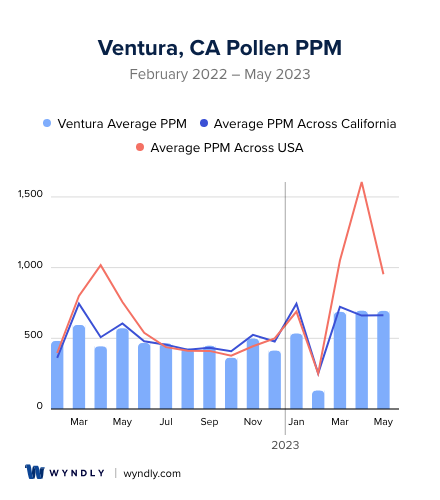
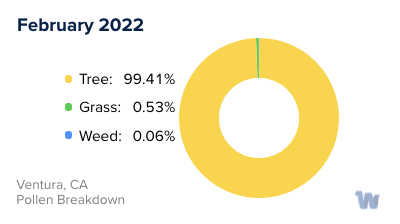
When is pollen lowest in Ventura, CA?

Green down arrow

February

Lowest month total PPM

130.75 Avg. PPM

When is pollen highest in Ventura, CA?
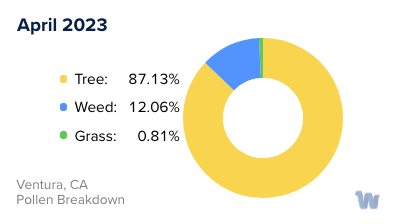
Red up arrow

April

Highest month total PPM

695.31 Avg. PPM

How does pollen in Ventura, CA compare to California?

Ventura has a lower average PPM than the state of California.

Ventura yearly avg PPM: 494.41

California yearly avg PPM: 528.52

How does pollen in Ventura, CA compare to the USA?

Ventura has a lower average PPM than the USA.

Ventura yearly avg PPM: 494.41

USA yearly avg PPM: 664.86

Is pollen worse this year in Ventura, CA?

Spring 2023 was worse than spring 2022.

Spring 2023 PPM: 2,076.17

Spring 2022 PPM: 1,608.18

Average PPM in Ventura, CA

Ventura, CA Average PPM Ventura, CA Average PPM

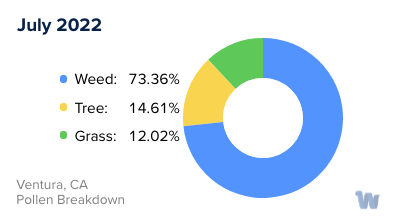
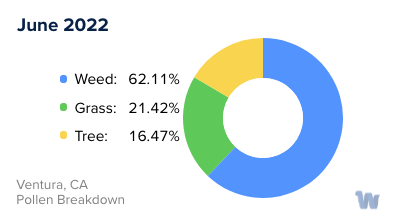
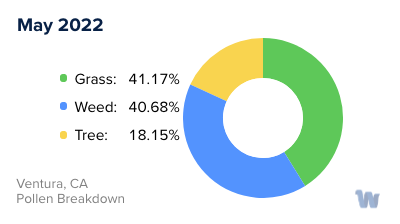
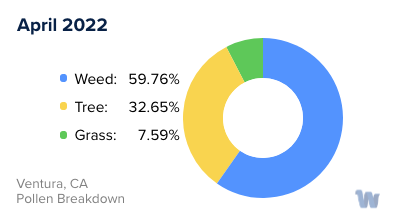
Ventura, CA Pollen and Allergy Breakdown by Month

Grass

When is grass pollen highest in Ventura, CA?

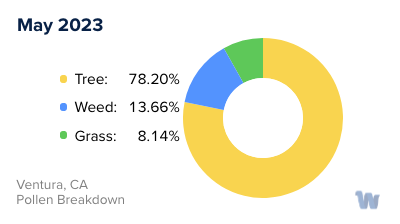
May has the highest grass pollen in Ventura, CA with an average PPM of 235.07

When is grass pollen lowest in Ventura, CA?

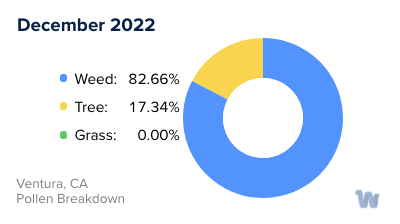
December has the lowest grass pollen in Ventura, CA with an average PPM of 0

Tree

When is tree pollen highest in Ventura, CA?

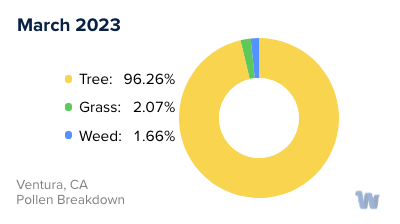
March has the highest tree pollen in Ventura, CA with an average PPM of 661.26

When is tree pollen lowest in Ventura, CA?

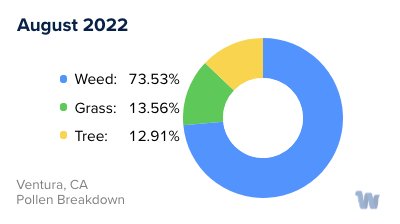
August has the lowest tree pollen in Ventura, CA with an average PPM of 55.16

Weed

When is weed pollen highest in Ventura, CA?

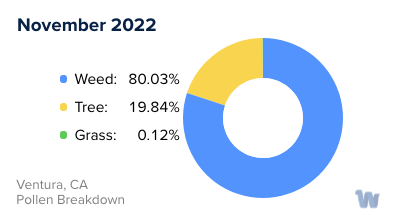
November has the highest weed pollen in Ventura, CA with an average PPM of 398.76

When is weed pollen lowest in Ventura, CA?

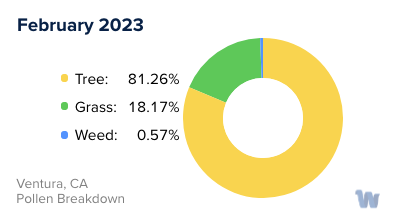
February has the lowest weed pollen in Ventura, CA with an average PPM of 0.29

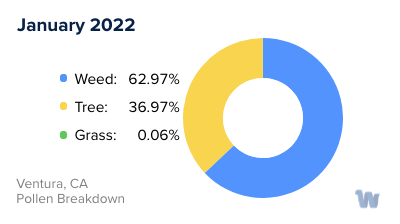
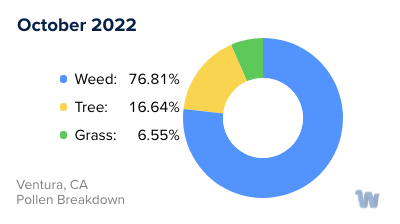
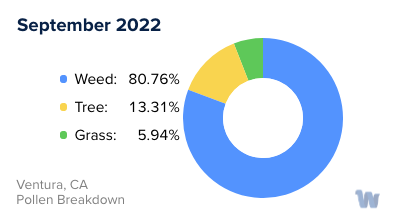
Ventura, CA Pollen Monthly Breakdown by Pollen Type

Ventura, CA Monthly Pollen Breakdown

Pollen and Hay Fever in Ventura, CA

In the picturesque city of Ventura, California, with its idyllic beaches and balmy weather, pollen allergies and hay fever can sometimes put a damper on the outdoor fun. Pollen allergies, often referred to as hay fever or allergic rhinitis, are an immune response to the tiny grains released by plants for fertilization. In Ventura, the various flora contributes to different types of pollen which can trigger these allergies.

One of the most prevalent types of pollen in Ventura is tree pollen. Trees such as oak, pine, and olive are bountiful in the region, and they typically release their pollen in the spring. During this season, residents and visitors with sensitivities may experience the classic symptoms of hay fever, such as sneezing, nasal congestion, and itchy eyes.

As spring transitions into summer, grass pollen takes center stage. The lush lawns and green spaces in Ventura are mainly comprised of Bermuda, ryegrass, and Kentucky bluegrass. These grasses release pollen into the air, which can also cause allergic reactions.

Furthermore, in late summer and early fall, weed pollen, particularly from plants like sagebrush and ragweed, becomes more prominent. Though ragweed is not native to California, it has found its way to the Golden State and thrives in the temperate climate of Ventura.

Living or visiting Ventura is an enchanting experience, but it's essential to be mindful of the varying pollen seasons. Being aware of the types of pollen in the air and their respective peaks can help individuals with allergies make informed decisions about their outdoor activities, ensuring a pleasant time in this beautiful coastal city.

Ventura, CA Map

What is Wyndly?

Wyndly is the easiest and most convenient way to fix your allergies forever. As an online allergy practice, Wyndly offers at-home allergy testing and treatment. The main goal of Wyndly is to retrain the immune system to stop responding to allergens, providing lasting relief from allergies.

Here's how Wyndly works:

  1. Identify Allergy Triggers: The first step is to identify the allergy triggers. You can purchase an at-home allergy test from Wyndly, or if you have already done an allergy test elsewhere, you can share your existing test results. This allows the doctors at Wyndly to pinpoint which allergies need to be treated.
  2. Get Treated by a Real Doctor: Using medications that are similar to those used in allergy shots, a doctor creates a unique sublingual immunotherapy treatment plan to desensitize your immune system. This is done using FDA-approved sublingual tablets or clinically proven dosing for oral use.
  3. Live Better Without Symptoms: The prescriptions are shipped to your door, and the doctor works with you until you’re better. Wyndly offers regular online check-ins with US-licensed physicians and 24/7 availability for questions or concerns via text, email, or call.

The treatment plans are personalized based on your specific allergy triggers and aim to treat allergies at their source, rather than just relieving symptoms for a short period. Most people report improvement in as little as one month.

Start with Wyndly today

Wyndly Summer 2023 Pollen Report Methodology

For each city, Wyndly obtained monthly pollen PPMs (pollen grains per cubic meter) for each form (tree, grass, and weed) from February 2022 - May 2023. Data were obtained from Pollen Sense, LLC Automated Particulate Sensors (APS). These sensors automatically detect particulate matter collected from ambient air, and use a neural network algorithm to identify individual pollen species and calculate daily pollen counts.

Yearly averages are calculated by summing the three allergen averages per month of data for a total monthly PPM, summing all monthly total PPMs, then dividing by 12 (month count). Used for per-city average, state average, and total USA average. Season comparisons are done by summing the months of Spring (March, April, May) for 2023 and 2022. If the absolute of the (2023-2022)/2022 is ≤ 0.05, the years were about the same. Otherwise, the more PPM, the worse the season was.

Is Wyndly right for you?

Answer just a few questions and we'll help you find out.

Get Started Today

Pollen and Allergy Reports by City