Visalia, CA Pollen and Allergy Report for Summer 2023

Pollen Allergy Trends in Visalia, CA

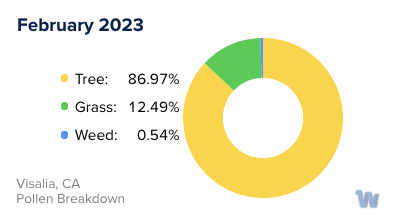
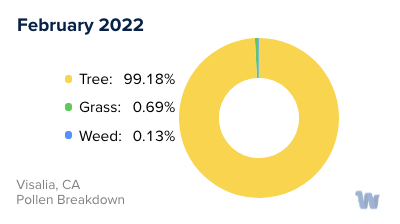
When is pollen lowest in Visalia, CA?

Green down arrow

February

Lowest month total PPM

134.73 Avg. PPM

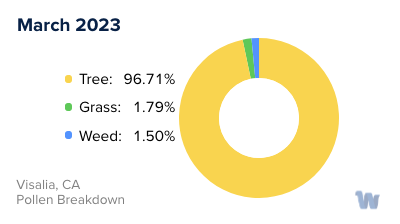
When is pollen highest in Visalia, CA?

Red up arrow

March

Highest month total PPM

763.42 Avg. PPM

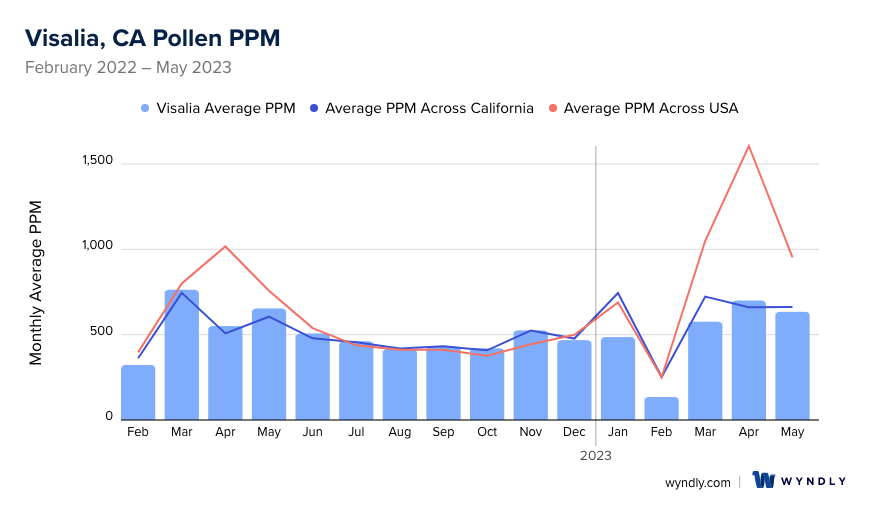
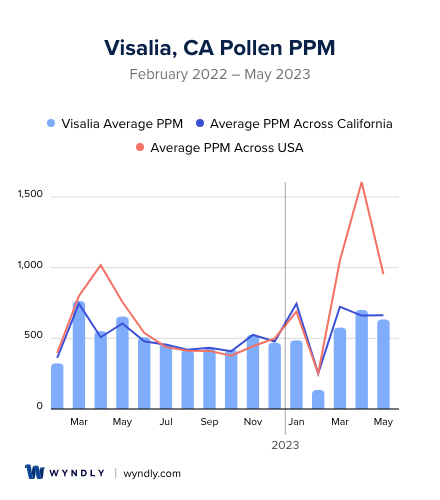
How does pollen in Visalia, CA compare to California?

Visalia has a lower average PPM than the state of California.

Visalia yearly avg PPM: 502.98

California yearly avg PPM: 528.52

How does pollen in Visalia, CA compare to the USA?

Visalia has a lower average PPM than the USA.

Visalia yearly avg PPM: 502.98

USA yearly avg PPM: 664.86

Is pollen worse this year in Visalia, CA?

Spring 2023 was about the same as 2022.

Spring 2023 PPM: 1,909.9

Spring 2022 PPM: 1,967.89

Average PPM in Visalia, CA

Visalia, CA Average PPM Visalia, CA Average PPM

Visalia, CA Pollen and Allergy Breakdown by Month

Grass

When is grass pollen highest in Visalia, CA?

May has the highest grass pollen in Visalia, CA with an average PPM of 255.64

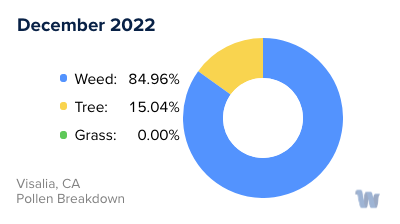
When is grass pollen lowest in Visalia, CA?

December has the lowest grass pollen in Visalia, CA with an average PPM of 0

Tree

When is tree pollen highest in Visalia, CA?

March has the highest tree pollen in Visalia, CA with an average PPM of 691.98

When is tree pollen lowest in Visalia, CA?

August has the lowest tree pollen in Visalia, CA with an average PPM of 56.38

Weed

When is weed pollen highest in Visalia, CA?

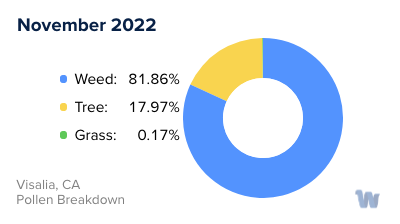
November has the highest weed pollen in Visalia, CA with an average PPM of 430.03

When is weed pollen lowest in Visalia, CA?

February has the lowest weed pollen in Visalia, CA with an average PPM of 0.43

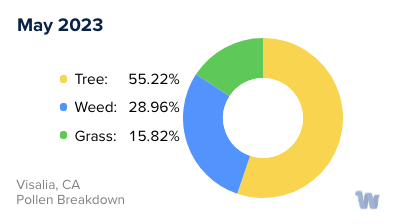
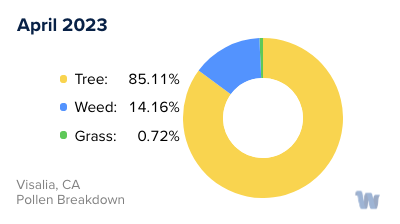
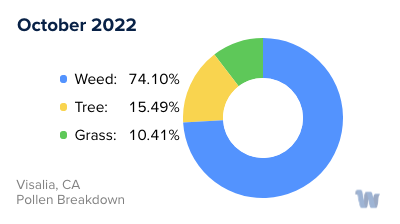
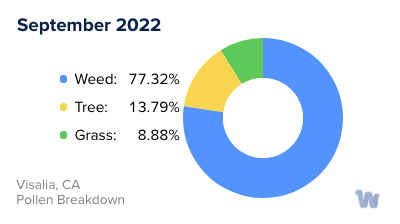
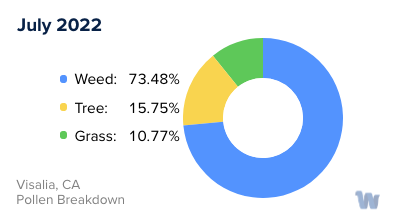
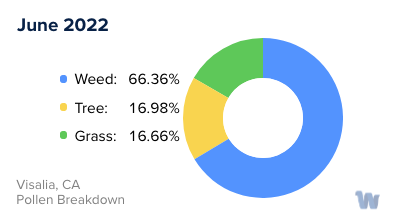
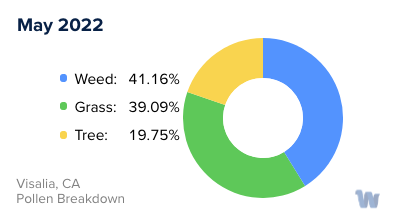
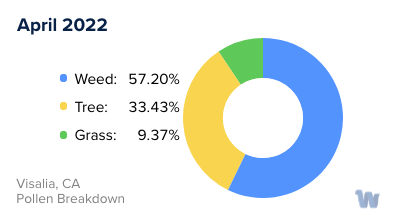
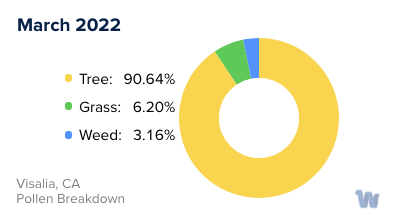
Visalia, CA Pollen Monthly Breakdown by Pollen Type

Visalia, CA Monthly Pollen Breakdown

Pollen and Hay Fever in Visalia, CA

In the vibrant city of Visalia, California, nestled in the heart of the San Joaquin Valley, the changing seasons bring with them an assortment of natural wonders. However, for some, the transitions also usher in the discomforts of pollen allergies and hay fever.

Pollen allergies, often referred to as hay fever or allergic rhinitis, are the body's reaction to airborne pollen particles. When these minuscule particles enter the nasal passages of sensitive individuals, the immune system may mistakenly interpret them as harmful, triggering an allergic reaction.

In Visalia, the types of pollen that are most prevalent vary with the seasons. During the spring, tree pollens are the prime culprits. Visalia is home to a variety of trees such as oaks, pines, and cottonwoods, whose pollen can lead to allergy symptoms. As the area transitions into summer, the focus shifts to grass pollens. Bermuda grass, ryegrasses, and Kentucky bluegrass are common in Visalia, and their pollen grains become more abundant in the warm months. By the time autumn rolls around, weed pollens take center stage. Ragweed, sagebrush, and nettles are some of the weeds that release pollen in the fall season in Visalia.

The mild winters in Visalia usually provide some respite from pollen allergies, as the cold temperatures suppress the growth and pollination of most plants. However, due to the city’s agricultural abundance, there might be exceptions, and some individuals could still experience symptoms.

Understanding the types of pollen and their seasonal prevalence in Visalia can help residents and visitors alike be more prepared and mindful of the environment around them. Being informed is the first step to navigating the challenges of pollen allergies and hay fever in this beautiful Californian city.

Visalia, CA Map

What is Wyndly?

Wyndly is the easiest and most convenient way to fix your allergies forever. As an online allergy practice, Wyndly offers at-home allergy testing and treatment. The main goal of Wyndly is to retrain the immune system to stop responding to allergens, providing lasting relief from allergies.

Here's how Wyndly works:

  1. Identify Allergy Triggers: The first step is to identify the allergy triggers. You can purchase an at-home allergy test from Wyndly, or if you have already done an allergy test elsewhere, you can share your existing test results. This allows the doctors at Wyndly to pinpoint which allergies need to be treated.
  2. Get Treated by a Real Doctor: Using medications that are similar to those used in allergy shots, a doctor creates a unique sublingual immunotherapy treatment plan to desensitize your immune system. This is done using FDA-approved sublingual tablets or clinically proven dosing for oral use.
  3. Live Better Without Symptoms: The prescriptions are shipped to your door, and the doctor works with you until you’re better. Wyndly offers regular online check-ins with US-licensed physicians and 24/7 availability for questions or concerns via text, email, or call.

The treatment plans are personalized based on your specific allergy triggers and aim to treat allergies at their source, rather than just relieving symptoms for a short period. Most people report improvement in as little as one month.

Start with Wyndly today

Wyndly Summer 2023 Pollen Report Methodology

For each city, Wyndly obtained monthly pollen PPMs (pollen grains per cubic meter) for each form (tree, grass, and weed) from February 2022 - May 2023. Data were obtained from Pollen Sense, LLC Automated Particulate Sensors (APS). These sensors automatically detect particulate matter collected from ambient air, and use a neural network algorithm to identify individual pollen species and calculate daily pollen counts.

Yearly averages are calculated by summing the three allergen averages per month of data for a total monthly PPM, summing all monthly total PPMs, then dividing by 12 (month count). Used for per-city average, state average, and total USA average. Season comparisons are done by summing the months of Spring (March, April, May) for 2023 and 2022. If the absolute of the (2023-2022)/2022 is ≤ 0.05, the years were about the same. Otherwise, the more PPM, the worse the season was.

Is Wyndly right for you?

Answer just a few questions and we'll help you find out.

Get Started Today

Pollen and Allergy Reports by City