West Covina, CA Pollen and Allergy Report for Summer 2023

Pollen Allergy Trends in West Covina, CA

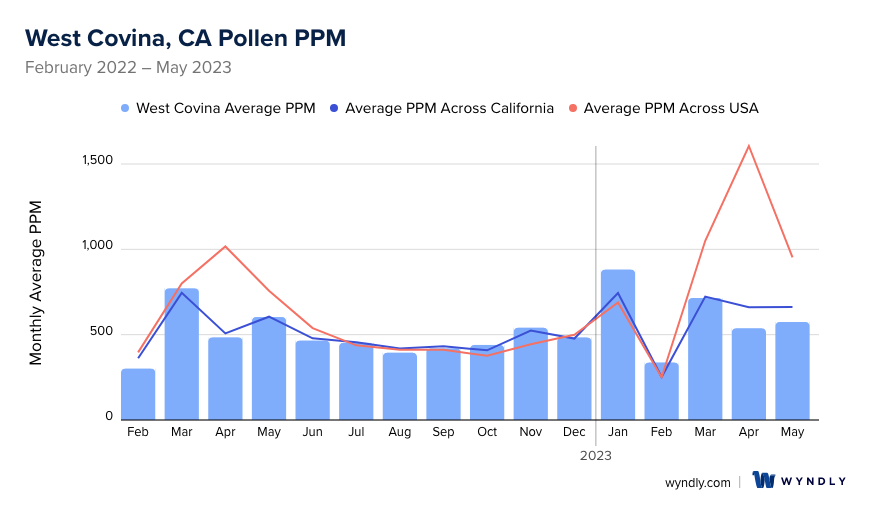
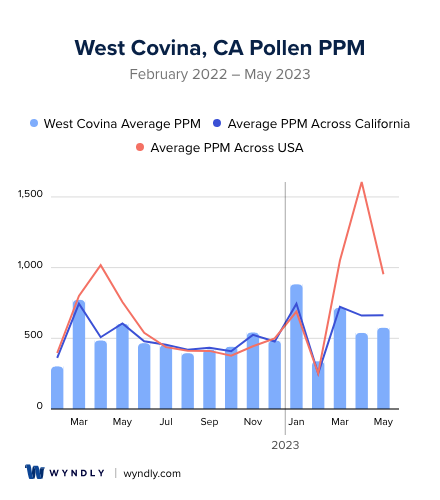
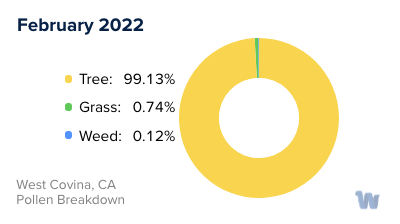
When is pollen lowest in West Covina, CA?
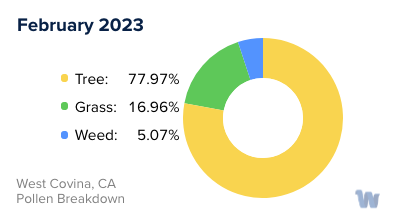
Green down arrow

February

Lowest month total PPM

301.36 Avg. PPM

When is pollen highest in West Covina, CA?
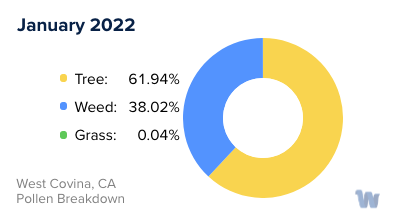
Red up arrow

January

Highest month total PPM

881.76 Avg. PPM

How does pollen in West Covina, CA compare to California?

West Covina has a lower average PPM than the state of California.

West Covina yearly avg PPM: 525.26

California yearly avg PPM: 528.52

How does pollen in West Covina, CA compare to the USA?

West Covina has a lower average PPM than the USA.

West Covina yearly avg PPM: 525.26

USA yearly avg PPM: 664.86

Is pollen worse this year in West Covina, CA?

Spring 2023 was about the same as 2022.

Spring 2023 PPM: 1,826.75

Spring 2022 PPM: 1,859.32

Average PPM in West Covina, CA

West Covina, CA Average PPM West Covina, CA Average PPM

West Covina, CA Pollen and Allergy Breakdown by Month

Grass

When is grass pollen highest in West Covina, CA?

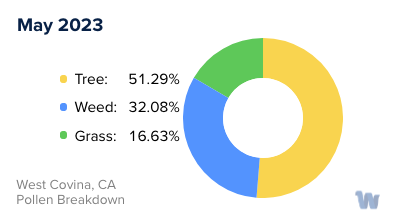
May has the highest grass pollen in West Covina, CA with an average PPM of 242.66

When is grass pollen lowest in West Covina, CA?

December has the lowest grass pollen in West Covina, CA with an average PPM of 0

Tree

When is tree pollen highest in West Covina, CA?

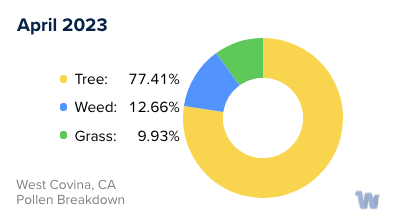
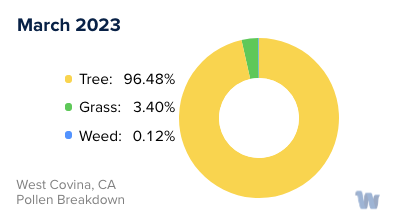
March has the highest tree pollen in West Covina, CA with an average PPM of 713.38

When is tree pollen lowest in West Covina, CA?

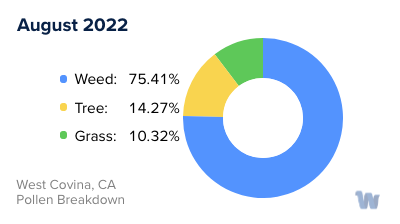
August has the lowest tree pollen in West Covina, CA with an average PPM of 56.33

Weed

When is weed pollen highest in West Covina, CA?

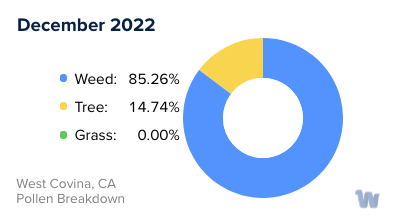
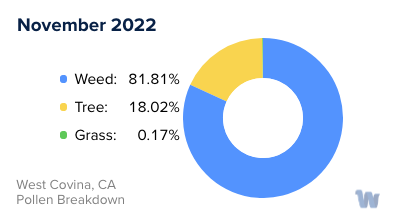
November has the highest weed pollen in West Covina, CA with an average PPM of 442.67

When is weed pollen lowest in West Covina, CA?

February has the lowest weed pollen in West Covina, CA with an average PPM of 0.37

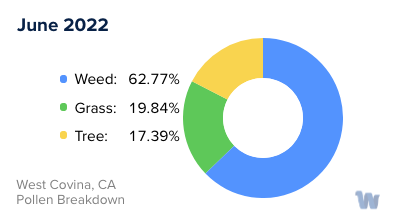
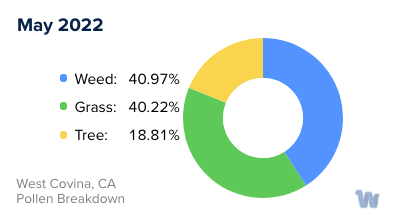
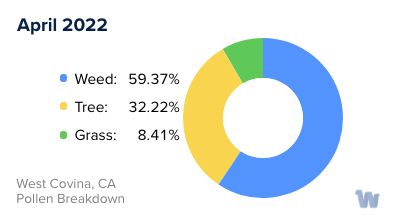
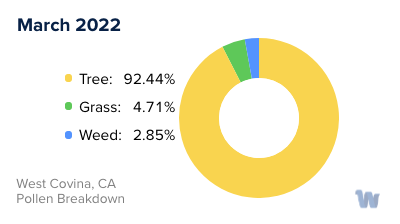
West Covina, CA Pollen Monthly Breakdown by Pollen Type

West Covina, CA Monthly Pollen Breakdown

Pollen and Hay Fever in West Covina, CA

In the picturesque city of West Covina, California, the blooming flowers and lush greenery are not just a treat for the eyes, but sometimes a challenge for the sinuses. The region is a hotspot for pollen allergies, commonly referred to as hay fever.

One of the culprits behind the itchy eyes and sneezes is tree pollen. In West Covina, trees such as oaks, pines, and olive trees begin to release pollen as early as late winter and continue through the spring. This is the time when residents may notice a fine dusting of yellow on their cars and sidewalks, which is actually pollen!,As spring turns into summer, grass pollen takes center stage. Bermuda, Kentucky bluegrass, and ryegrasses are common in Southern California, and they release pollen that can cause allergic reactions. If you’re an outdoor enthusiast, be mindful of grassy areas during the early summer months.

Towards the end of summer and beginning of fall, the main source of pollen shifts to weeds. In West Covina, ragweed is a common weed that releases copious amounts of pollen into the air. Other weeds such as sagebrush and tumbleweed also contribute to the pollen count.

The varying climate in West Covina means that different types of pollen are in the air at different times of the year. The mild winters allow for early tree pollen, while the warm summers support grass growth. The transition into fall brings weed pollen to the forefront.

Being aware of the pollen seasons in West Covina is the first step in understanding what triggers your allergies. While the natural beauty of the city is undeniable, the pollen from trees, grasses, and weeds might cause some residents to keep their tissues handy.

West Covina, CA Map

What is Wyndly?

Wyndly is the easiest and most convenient way to fix your allergies forever. As an online allergy practice, Wyndly offers at-home allergy testing and treatment. The main goal of Wyndly is to retrain the immune system to stop responding to allergens, providing lasting relief from allergies.

Here's how Wyndly works:

  1. Identify Allergy Triggers: The first step is to identify the allergy triggers. You can purchase an at-home allergy test from Wyndly, or if you have already done an allergy test elsewhere, you can share your existing test results. This allows the doctors at Wyndly to pinpoint which allergies need to be treated.
  2. Get Treated by a Real Doctor: Using medications that are similar to those used in allergy shots, a doctor creates a unique sublingual immunotherapy treatment plan to desensitize your immune system. This is done using FDA-approved sublingual tablets or clinically proven dosing for oral use.
  3. Live Better Without Symptoms: The prescriptions are shipped to your door, and the doctor works with you until you’re better. Wyndly offers regular online check-ins with US-licensed physicians and 24/7 availability for questions or concerns via text, email, or call.

The treatment plans are personalized based on your specific allergy triggers and aim to treat allergies at their source, rather than just relieving symptoms for a short period. Most people report improvement in as little as one month.

Start with Wyndly today

Wyndly Summer 2023 Pollen Report Methodology

For each city, Wyndly obtained monthly pollen PPMs (pollen grains per cubic meter) for each form (tree, grass, and weed) from February 2022 - May 2023. Data were obtained from Pollen Sense, LLC Automated Particulate Sensors (APS). These sensors automatically detect particulate matter collected from ambient air, and use a neural network algorithm to identify individual pollen species and calculate daily pollen counts.

Yearly averages are calculated by summing the three allergen averages per month of data for a total monthly PPM, summing all monthly total PPMs, then dividing by 12 (month count). Used for per-city average, state average, and total USA average. Season comparisons are done by summing the months of Spring (March, April, May) for 2023 and 2022. If the absolute of the (2023-2022)/2022 is ≤ 0.05, the years were about the same. Otherwise, the more PPM, the worse the season was.

Is Wyndly right for you?

Answer just a few questions and we'll help you find out.

Get Started Today

Pollen and Allergy Reports by City