Thornton, CO Pollen and Allergy Report for Summer 2023

Pollen Allergy Trends in Thornton, CO
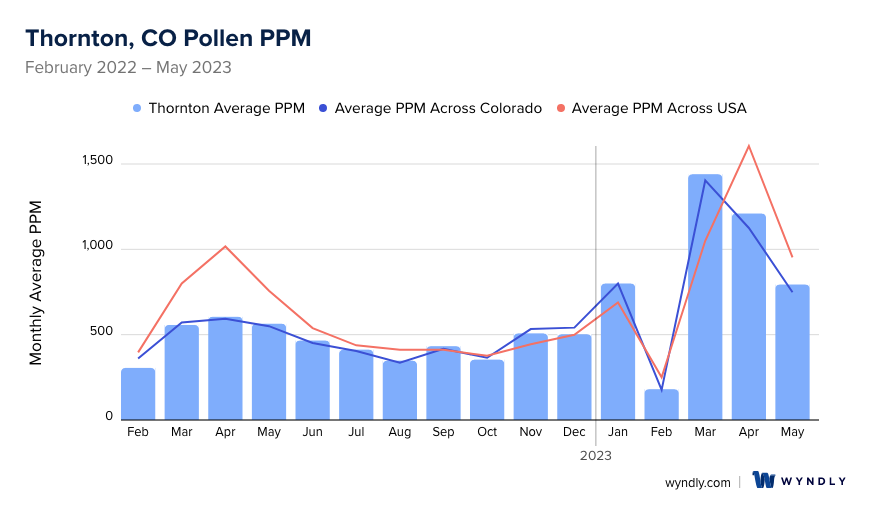
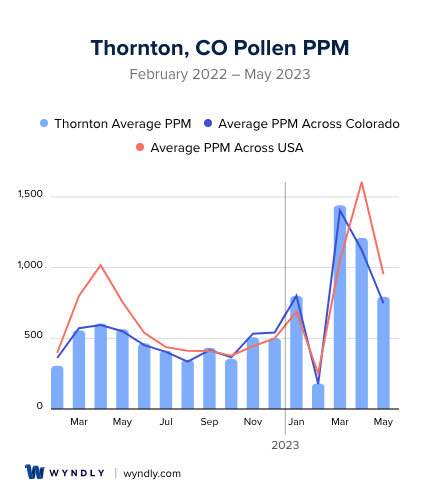
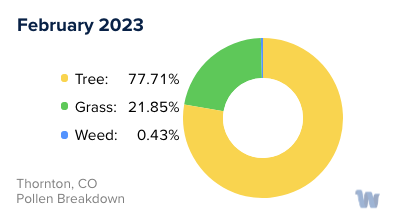
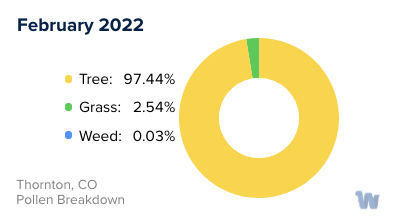
When is pollen lowest in Thornton, CO?
February
Lowest month total PPM
Avg. PPM
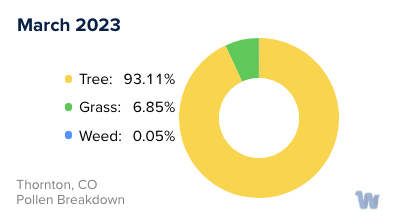
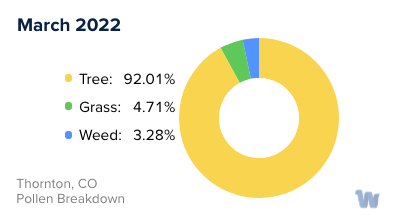
When is pollen highest in Thornton, CO?
March
Highest month total PPM
Avg. PPM
How does pollen in Thornton, CO compare to Colorado?
Thornton has a higher average PPM than the state of Colorado.
Thornton yearly avg PPM:
Colorado yearly avg PPM:
How does pollen in Thornton, CO compare to the USA?
Thornton has a lower average PPM than the USA.
Thornton yearly avg PPM:
USA yearly avg PPM:
Is pollen worse this year in Thornton, CO?
Spring 2023 was worse than spring 2022.
Spring 2023 PPM:
Spring 2022 PPM:
Average PPM in Thornton, CO
Thornton, CO Pollen and Allergy Breakdown by Month
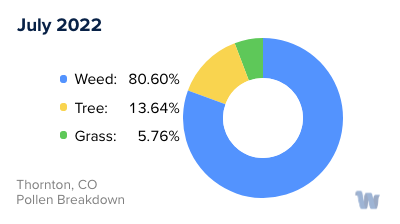
Grass
When is grass pollen highest in Thornton, CO?
April has the highest grass pollen in Thornton, CO with an average PPM of
When is grass pollen lowest in Thornton, CO?
December has the lowest grass pollen in Thornton, CO with an average PPM of
Tree
When is tree pollen highest in Thornton, CO?
March has the highest tree pollen in Thornton, CO with an average PPM of
When is tree pollen lowest in Thornton, CO?
September has the lowest tree pollen in Thornton, CO with an average PPM of
Weed
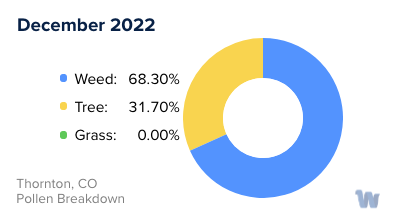
When is weed pollen highest in Thornton, CO?
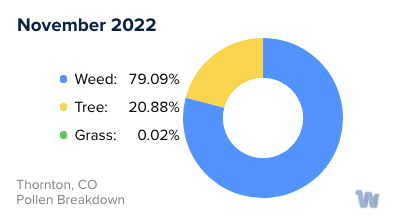
November has the highest weed pollen in Thornton, CO with an average PPM of
When is weed pollen lowest in Thornton, CO?
February has the lowest weed pollen in Thornton, CO with an average PPM of
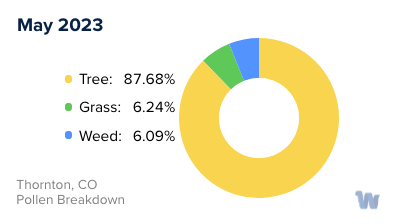
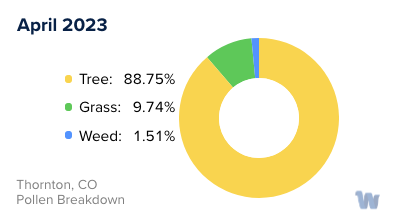
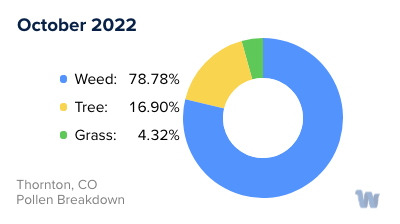
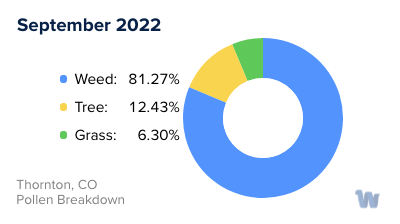
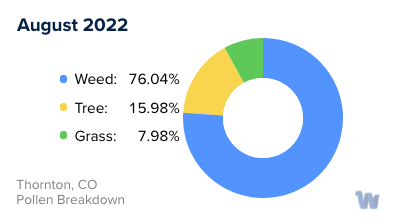
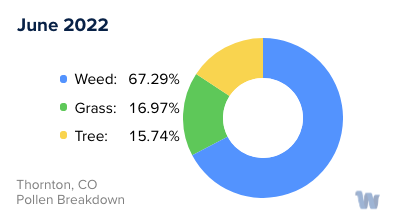
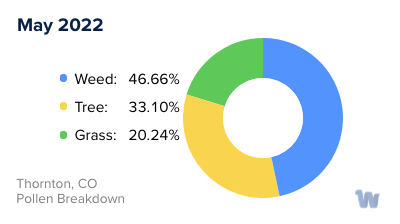
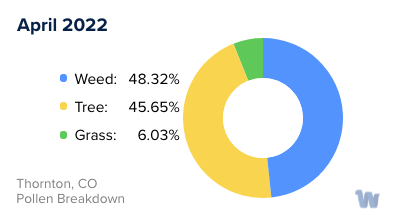
Thornton, CO Pollen Monthly Breakdown by Pollen Type
Pollen and Hay Fever in Thornton, CO
In the picturesque city of Thornton, Colorado, the changing seasons bring an array of vibrant colors and fragrances. However, for some residents, these transitions are accompanied by sneezing, runny noses, and itchy eyes due to pollen allergies, often referred to as hay fever. Thornton, located near the Rocky Mountains, experiences a diverse mix of vegetation, which in turn results in various types of pollen.
In the springtime, trees are the primary source of pollen. From as early as March, the budding oaks, pines, and cottonwoods release copious amounts of pollen into the air. The gentle spring breezes carry these tiny particles across the city, which can be especially bothersome for those with a sensitivity to tree pollen.
As Thornton's landscape transitions into summer, grasses take center stage in the pollen production. Between June and July, the city's lush meadows and lawns release pollen from grasses such as Kentucky bluegrass, ryegrass, and fescue. For some individuals, this grass pollen can be even more irksome than the tree pollen of spring.
Come fall, the culprits behind pollen allergies in Thornton are weeds. Ragweed is a common offender, with its lightweight pollen easily dispersed by the wind. Other weeds, like sagebrush and lamb’s quarters, are also contributors to the autumnal allergy season.
While Thornton's residents may delight in the city's natural beauty, it’s important to be cognizant of the pollen that each season brings. Understanding the types of pollen and their respective seasons can help individuals anticipate and prepare for the times of year when their allergies may be at their peak. Through awareness, the community can continue to relish the splendors of Thornton’s changing seasons while being mindful of the challenges faced by those with pollen allergies.