Springfield, IL Pollen and Allergy Report for Summer 2023

Pollen Allergy Trends in Springfield, IL
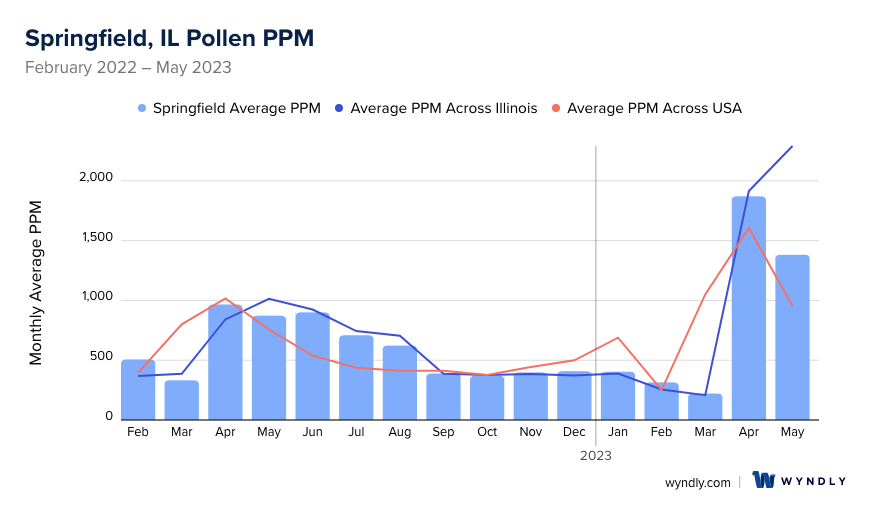
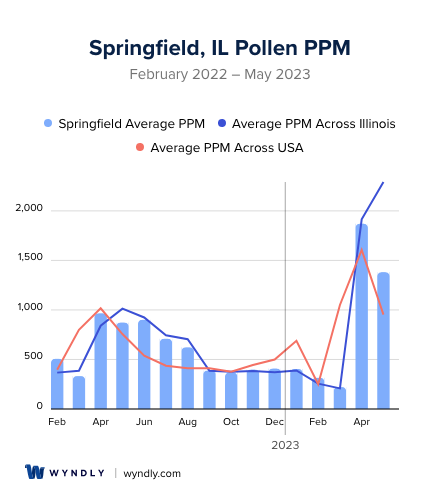
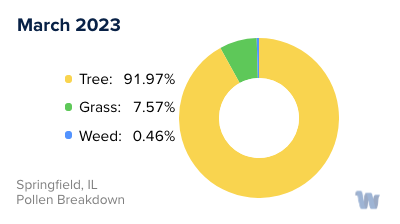
When is pollen lowest in Springfield, IL?
March
Lowest month total PPM
Avg. PPM
When is pollen highest in Springfield, IL?
April
Highest month total PPM
Avg. PPM
How does pollen in Springfield, IL compare to Illinois?
Springfield has a lower average PPM than the state of Illinois.
Springfield yearly avg PPM:
Illinois yearly avg PPM:
How does pollen in Springfield, IL compare to the USA?
Springfield has a higher average PPM than the USA.
Springfield yearly avg PPM:
USA yearly avg PPM:
Is pollen worse this year in Springfield, IL?
Spring 2023 was worse than spring 2022.
Spring 2023 PPM:
Spring 2022 PPM:
Average PPM in Springfield, IL
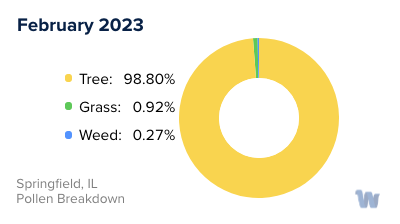
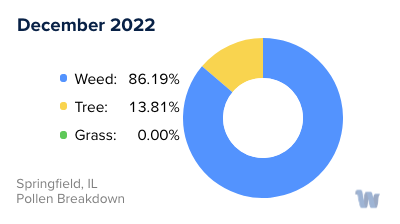
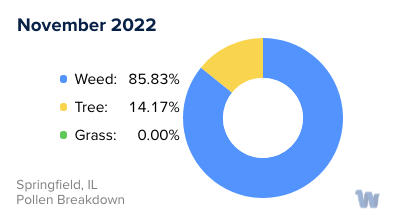
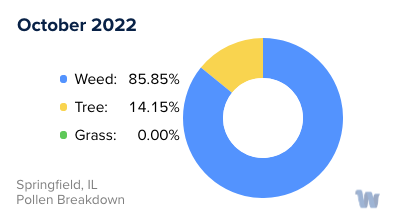
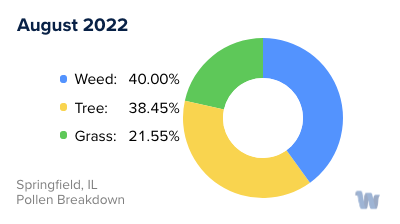
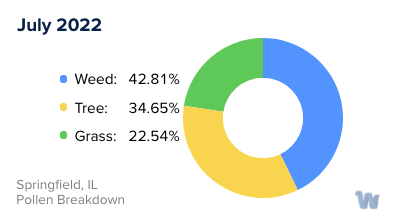
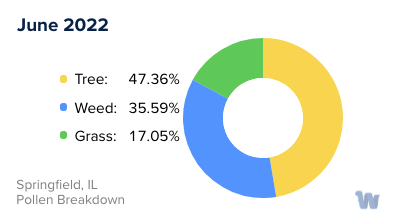
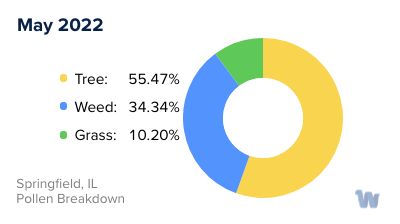
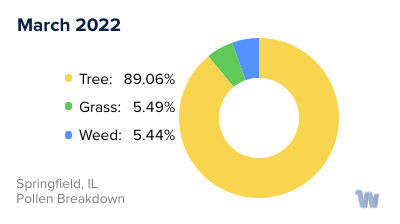
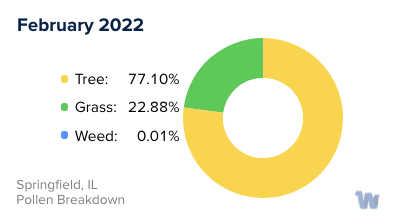
Springfield, IL Pollen and Allergy Breakdown by Month
Grass
When is grass pollen highest in Springfield, IL?
July has the highest grass pollen in Springfield, IL with an average PPM of
When is grass pollen lowest in Springfield, IL?
October has the lowest grass pollen in Springfield, IL with an average PPM of
Tree
When is tree pollen highest in Springfield, IL?
April has the highest tree pollen in Springfield, IL with an average PPM of
When is tree pollen lowest in Springfield, IL?
October has the lowest tree pollen in Springfield, IL with an average PPM of
Weed
When is weed pollen highest in Springfield, IL?
April has the highest weed pollen in Springfield, IL with an average PPM of
When is weed pollen lowest in Springfield, IL?
February has the lowest weed pollen in Springfield, IL with an average PPM of
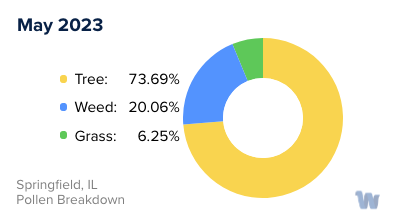
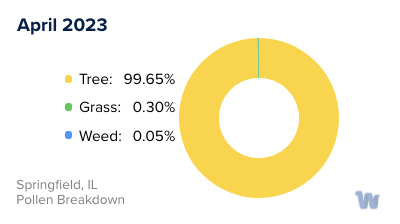
Springfield, IL Pollen Monthly Breakdown by Pollen Type


Pollen and Hay Fever in Springfield, IL
As spring and summer unfold in Springfield, Illinois, so does the annual occurrence of pollen allergies, commonly known as hay fever. With the city's diverse vegetation, Springfield becomes a hotbed of pollen production that can trigger allergic reactions in many of its residents.
The primary culprits for these seasonal allergies in Springfield are tree, grass, and weed pollens. Each of these have their own unique pollination seasons, leading to a prolonged period of potential allergy triggers throughout much of the year.
Tree pollens are the first to make their appearance, usually starting in late winter and extending into spring. The city is home to a variety of trees including oak, maple, and pine, all of which are significant producers of pollen. These trees release their pollen into the air, resulting in an invisible mist that can travel for miles, making almost no place in Springfield immune from their reach.
Following the tree pollen season, grass pollen takes the stage from late spring into early summer. Timothy grass, Kentucky bluegrass, and ryegrass are common in Springfield and are known to be potent triggers of hay fever. Their pollen grains are microscopic but can cause outsized allergic reactions, transforming beautiful sunny days into a season of sniffles and sneezes for allergy sufferers.
The last pollen season of the year is from weeds, which typically starts in late summer and extends into fall. The most common weed in Springfield is ragweed, a plant notorious for its allergy-inducing pollen. A single ragweed plant can produce up to a billion grains of pollen per season, saturating the air with potential allergens.
Despite the challenges that these pollen seasons present, many people find ways to enjoy the natural beauty of Springfield while minimizing their allergy symptoms. Understanding the types of pollen and their seasons is the first step towards managing pollen allergies and making the most of life in this vibrant city.