Shreveport, LA Pollen and Allergy Report for Summer 2023

Pollen Allergy Trends in Shreveport, LA
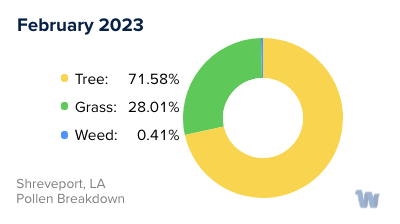
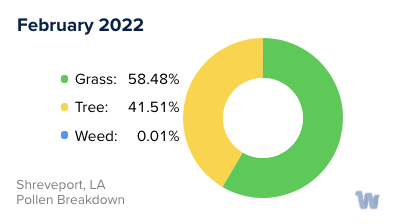
When is pollen lowest in Shreveport, LA?
February
Lowest month total PPM
Avg. PPM
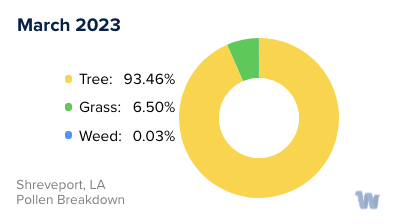
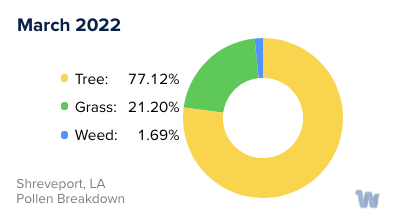
When is pollen highest in Shreveport, LA?
March
Highest month total PPM
Avg. PPM
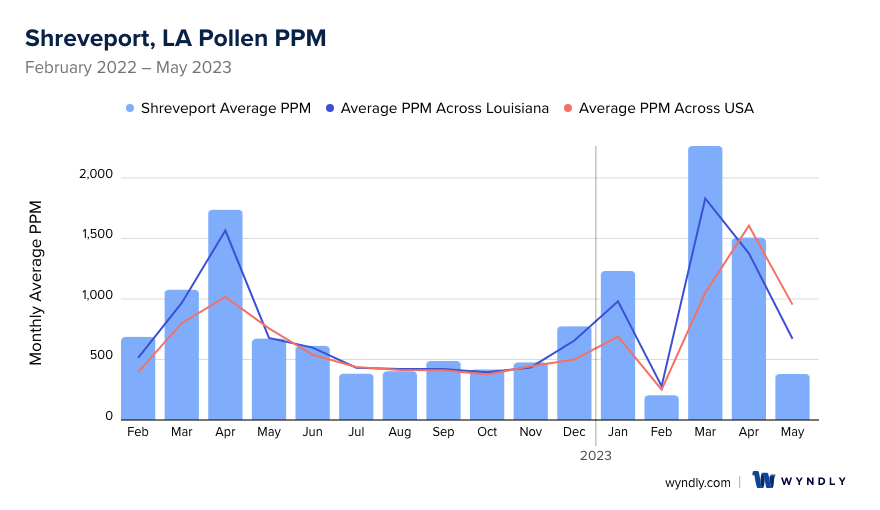
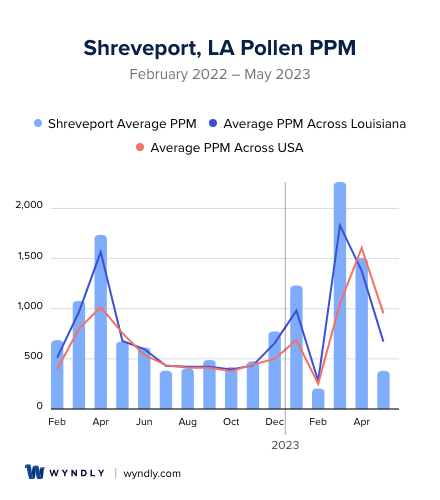
How does pollen in Shreveport, LA compare to Louisiana?
Shreveport has a higher average PPM than the state of Louisiana.
Shreveport yearly avg PPM:
Louisiana yearly avg PPM:
How does pollen in Shreveport, LA compare to the USA?
Shreveport has a higher average PPM than the USA.
Shreveport yearly avg PPM:
USA yearly avg PPM:
Is pollen worse this year in Shreveport, LA?
Spring 2023 was worse than spring 2022.
Spring 2023 PPM:
Spring 2022 PPM:
Average PPM in Shreveport, LA
Shreveport, LA Pollen and Allergy Breakdown by Month
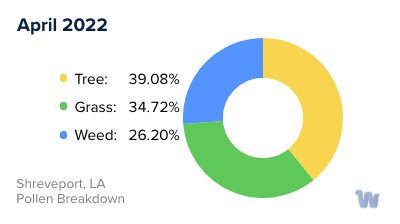
Grass
When is grass pollen highest in Shreveport, LA?
April has the highest grass pollen in Shreveport, LA with an average PPM of
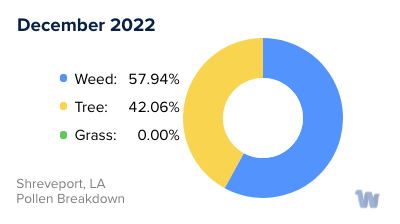
When is grass pollen lowest in Shreveport, LA?
December has the lowest grass pollen in Shreveport, LA with an average PPM of
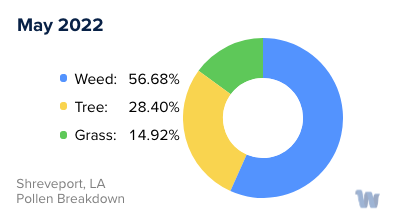
Tree
When is tree pollen highest in Shreveport, LA?
March has the highest tree pollen in Shreveport, LA with an average PPM of
When is tree pollen lowest in Shreveport, LA?
July has the lowest tree pollen in Shreveport, LA with an average PPM of
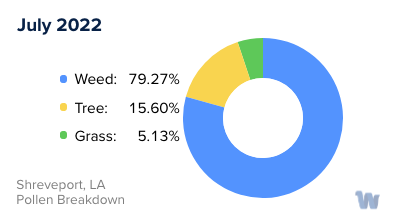
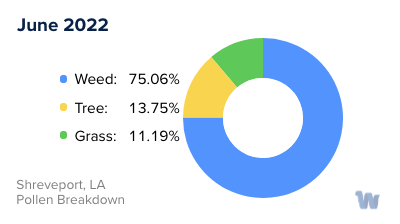
Weed
When is weed pollen highest in Shreveport, LA?
June has the highest weed pollen in Shreveport, LA with an average PPM of
When is weed pollen lowest in Shreveport, LA?
February has the lowest weed pollen in Shreveport, LA with an average PPM of
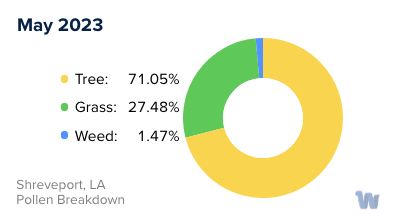
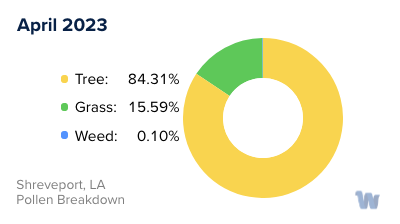
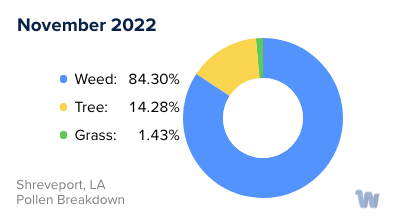
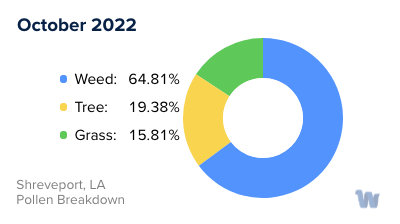
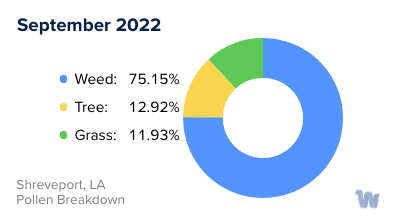
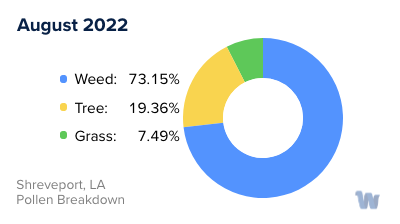
Shreveport, LA Pollen Monthly Breakdown by Pollen Type
Pollen and Hay Fever in Shreveport, LA
Pollen allergies, often referred to as hay fever, are a common concern for many residents of Shreveport, Louisiana. These allergies are typically triggered by the pollen from trees, grasses, and weeds that are common in this region.
In Shreveport, tree pollen is the earliest seasonal allergen to emerge, typically surfacing in late winter and early spring. Oak, cedar, and pine are the main culprits, releasing copious amounts of pollen that can spark allergy symptoms. On windy days, tree pollen can travel vast distances, making it difficult to escape its reach.
Grass pollen follows in late spring and early summer. The leading producers of allergenic pollen in Shreveport are Bermuda grass and ryegrass, both of which flourish in the local climate. This type of pollen tends to stay closer to the ground, but can still cause considerable discomfort for allergy sufferers.
Weed pollen, particularly from ragweed, is most prevalent in late summer and fall. This plant is a robust survivor and can be found throughout the Shreveport area. Each ragweed plant is capable of producing up to one billion grains of pollen per season, contributing significantly to the overall pollen count.
The severity of pollen allergies in Shreveport can be influenced by weather conditions. Dry, windy days are prime conditions for pollen dispersal, increasing the likelihood of exposure and subsequent allergic reactions. Conversely, rainy days help to clear pollen from the air, providing some relief for those with allergies.
While pollen allergies can be disruptive, understanding the types of pollen and their respective seasons can help residents of Shreveport anticipate and prepare for their arrival. It's also helpful to keep in mind that the timing and severity of pollen seasons can vary from year to year, influenced by factors such as temperature, rainfall, and daylight hours.