Worcester, MA Pollen and Allergy Report for Summer 2023

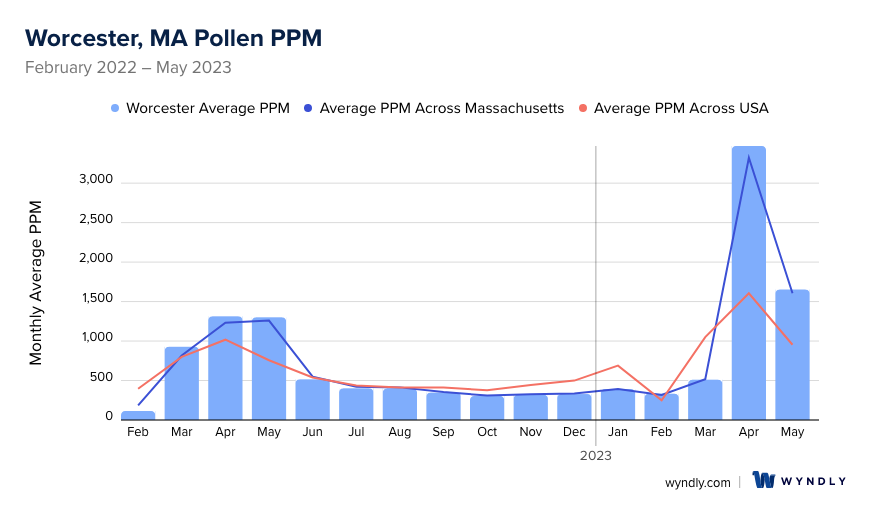
Pollen Allergy Trends in Worcester, MA
When is pollen lowest in Worcester, MA?
February
Lowest month total PPM
Avg. PPM
When is pollen highest in Worcester, MA?
April
Highest month total PPM
Avg. PPM
How does pollen in Worcester, MA compare to Massachusetts?
Worcester has a higher average PPM than the state of Massachusetts.
Worcester yearly avg PPM:
Massachusetts yearly avg PPM:
How does pollen in Worcester, MA compare to the USA?
Worcester has a higher average PPM than the USA.
Worcester yearly avg PPM:
USA yearly avg PPM:
Is pollen worse this year in Worcester, MA?
Spring 2023 was worse than spring 2022.
Spring 2023 PPM:
Spring 2022 PPM:
Average PPM in Worcester, MA
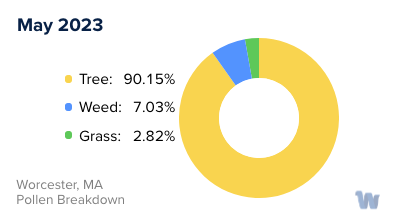
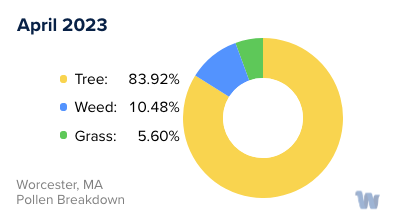
Worcester, MA Pollen and Allergy Breakdown by Month
Grass
When is grass pollen highest in Worcester, MA?
April has the highest grass pollen in Worcester, MA with an average PPM of
When is grass pollen lowest in Worcester, MA?
December has the lowest grass pollen in Worcester, MA with an average PPM of
Tree
When is tree pollen highest in Worcester, MA?
April has the highest tree pollen in Worcester, MA with an average PPM of
When is tree pollen lowest in Worcester, MA?
October has the lowest tree pollen in Worcester, MA with an average PPM of
Weed
When is weed pollen highest in Worcester, MA?
April has the highest weed pollen in Worcester, MA with an average PPM of
When is weed pollen lowest in Worcester, MA?
February has the lowest weed pollen in Worcester, MA with an average PPM of
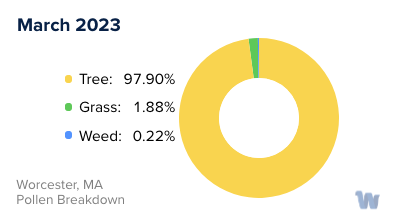
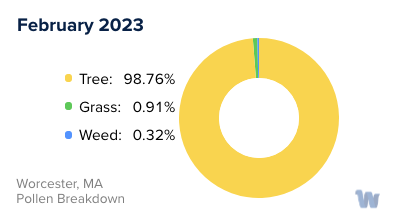
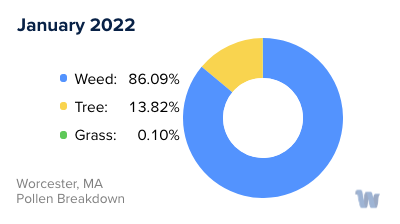
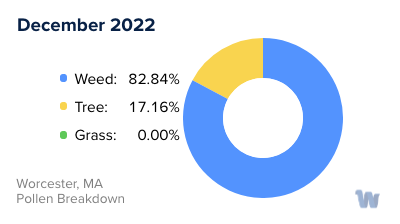
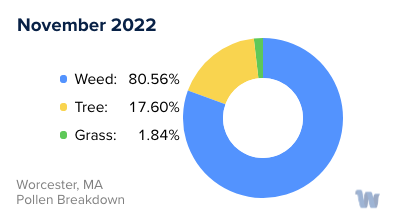
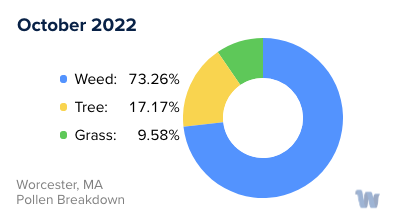
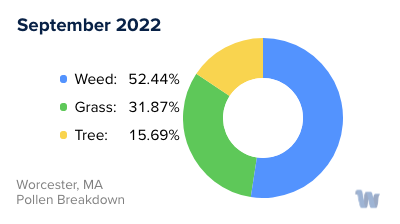
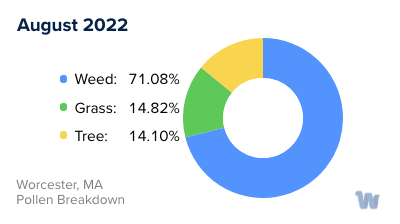
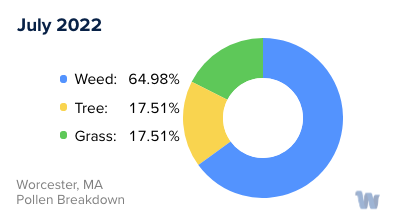
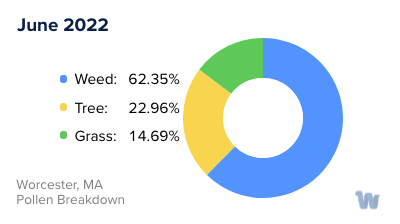
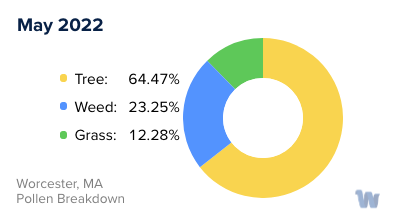
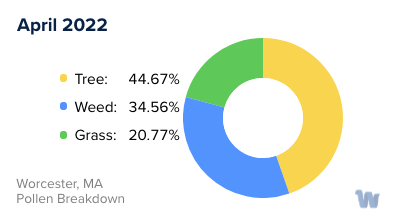
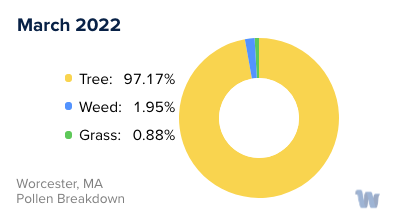
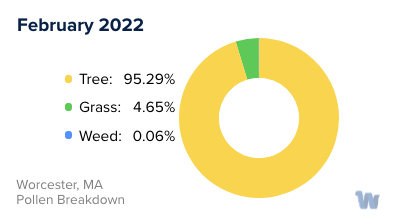
Worcester, MA Pollen Monthly Breakdown by Pollen Type
Pollen and Hay Fever in Worcester, MA
In the picturesque city of Worcester, Massachusetts, the changing seasons bring an array of vibrant colors and lush landscapes. However, for many residents, this seasonal transition is a double-edged sword, as the blossoming flora means an increase in airborne pollen, often leading to pollen allergies and hay fever.
Pollen allergies, commonly known as hay fever, occur when the immune system overreacts to pollen from trees, grasses, and weeds. In Worcester, various types of pollen are in abundance. During the spring, tree pollen is particularly prevalent. Common trees in Worcester such as oak, elm, and maple produce copious amounts of pollen, which can trigger allergic reactions in sensitive individuals.
As the city transitions into summer, grass pollen takes center stage. Grasses such as Kentucky bluegrass and Timothy grass flourish in Worcester's temperate climate, releasing pollen into the air. The warm summer days can be somewhat bittersweet for residents who enjoy outdoor activities but struggle with pollen allergies.
In the fall, weed pollen becomes the primary culprit. Ragweed, a common weed in Worcester, releases pollen that is notorious for causing hay fever. Additionally, the mild temperatures and occasional rain showers characteristic of Worcester's autumn create ideal conditions for mold spores, which, although not pollen, can similarly aggravate allergies.
Throughout these seasons, the pollen count varies with changes in weather conditions. On windy days, pollen is swept into the air, increasing exposure, while rain can help to wash pollen from the air, providing some respite.
Understanding the types of pollen and their respective seasons can help the residents of Worcester stay informed and be mindful of the environmental factors that may affect their well-being. It is important to recognize that pollen allergies and hay fever are a natural response to the bountiful nature that this charming city has to offer. .