St. Louis, MO Pollen and Allergy Report for Summer 2023

Pollen Allergy Trends in St. Louis, MO
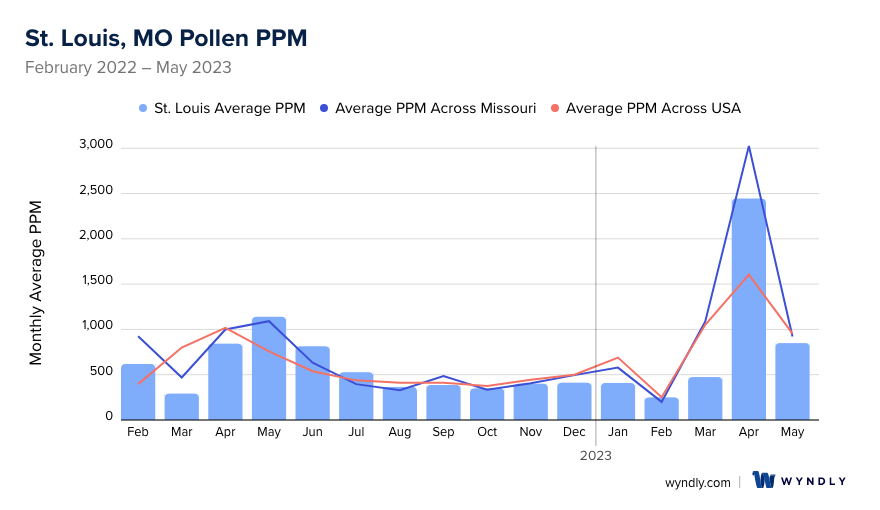
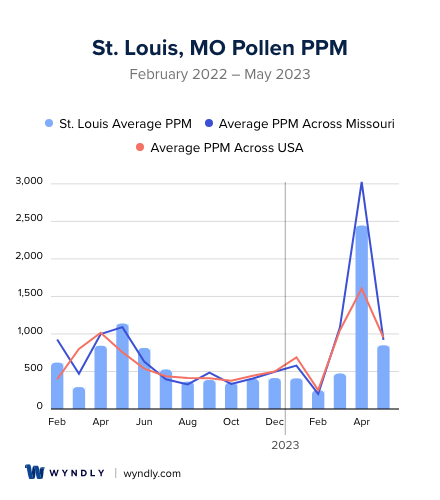
When is pollen lowest in St. Louis, MO?
February
Lowest month total PPM
Avg. PPM
When is pollen highest in St. Louis, MO?
April
Highest month total PPM
Avg. PPM
How does pollen in St. Louis, MO compare to Missouri?
St. Louis has a lower average PPM than the state of Missouri.
St. Louis yearly avg PPM:
Missouri yearly avg PPM:
How does pollen in St. Louis, MO compare to the USA?
St. Louis has a lower average PPM than the USA.
St. Louis yearly avg PPM:
USA yearly avg PPM:
Is pollen worse this year in St. Louis, MO?
Spring 2023 was worse than spring 2022.
Spring 2023 PPM:
Spring 2022 PPM:
Average PPM in St. Louis, MO
St. Louis, MO Pollen and Allergy Breakdown by Month
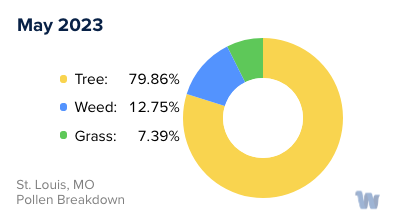
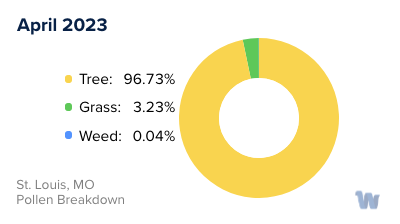
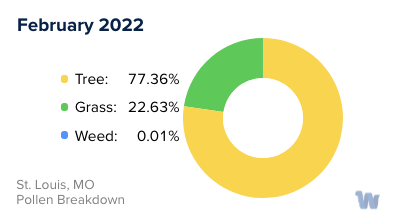
Grass
When is grass pollen highest in St. Louis, MO?
February has the highest grass pollen in St. Louis, MO with an average PPM of
When is grass pollen lowest in St. Louis, MO?
October has the lowest grass pollen in St. Louis, MO with an average PPM of
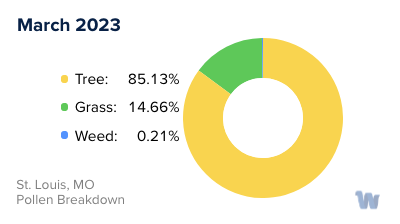
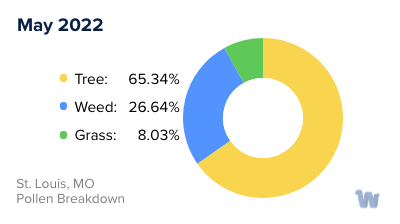
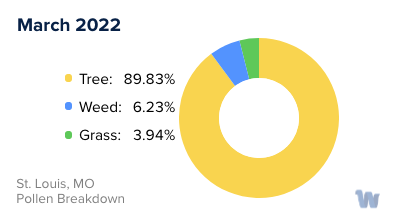
Tree
When is tree pollen highest in St. Louis, MO?
April has the highest tree pollen in St. Louis, MO with an average PPM of
When is tree pollen lowest in St. Louis, MO?
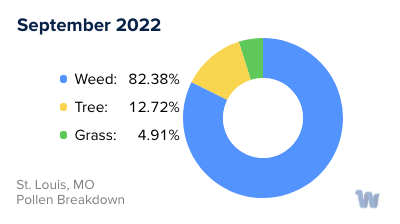
September has the lowest tree pollen in St. Louis, MO with an average PPM of
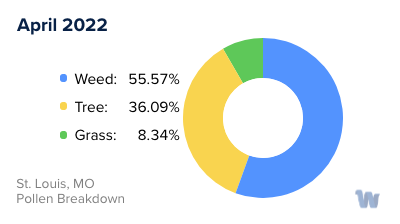
Weed
When is weed pollen highest in St. Louis, MO?
April has the highest weed pollen in St. Louis, MO with an average PPM of
When is weed pollen lowest in St. Louis, MO?
February has the lowest weed pollen in St. Louis, MO with an average PPM of
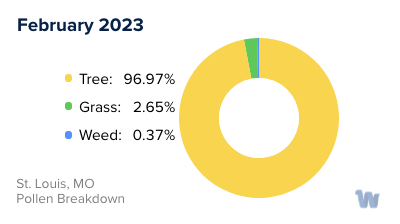
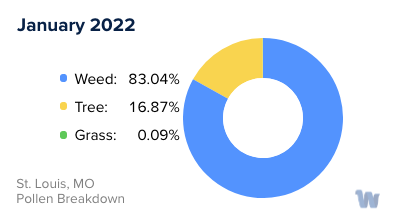
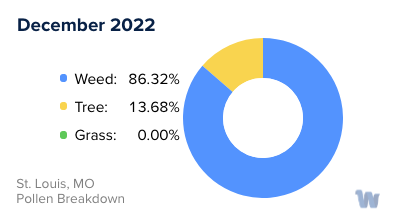
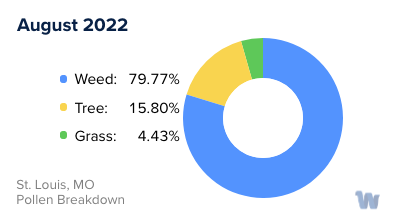
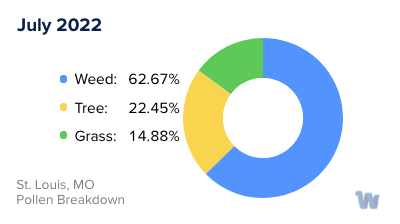
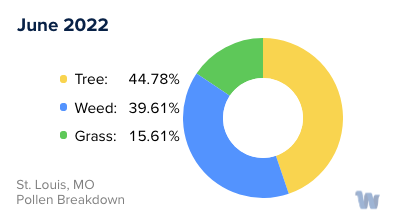
St. Louis, MO Pollen Monthly Breakdown by Pollen Type


Pollen and Hay Fever in St. Louis, MO
Living in St. Louis, Missouri, many residents find themselves subject to seasonal bouts of hay fever, a common ailment triggered primarily by pollen allergies. Known scientifically as allergic rhinitis, hay fever is a testament to the city's vibrant flora but can be a nuisance to those affected.
In St. Louis, three main types of pollen are prevalent: tree, grass, and weed pollen. Each has its peak season, resulting in an almost year-round cycle of allergenic potential.
Beginning in late winter and extending through spring, tree pollen becomes the main culprit. Oak, cedar, pine, and hickory are among the most common trees in St. Louis that release this fine, powdery substance into the air. The warm spring weather encourages trees to bloom, and as a result, tree pollen counts rise.
As spring transitions into summer, grass pollen takes center stage. The lush parks and green spaces that make St. Louis so picturesque are predominantly grassy areas. Timothy, Bermuda, Kentucky bluegrass, and ryegrass are some of the grass types that release pollen, contributing to the spike in hay fever cases during this season.
By late summer and throughout the fall, weed pollen, especially ragweed, dominates the allergy scene in St. Louis. Ragweed is particularly potent, with a single plant capable of producing up to a billion grains of pollen per season. It's this prolific pollen production that causes weed pollen to be the most common cause of hay fever symptoms in late summer and fall.
The cycle of pollen allergies in St. Louis is intrinsically tied to the changing seasons and the city's diverse plant life. By understanding the types of pollen and their seasons, residents can better anticipate and manage their hay fever symptoms, creating a more comfortable living environment in this vibrant city.