Sparks, NV Pollen and Allergy Report for Summer 2023

Pollen Allergy Trends in Sparks, NV

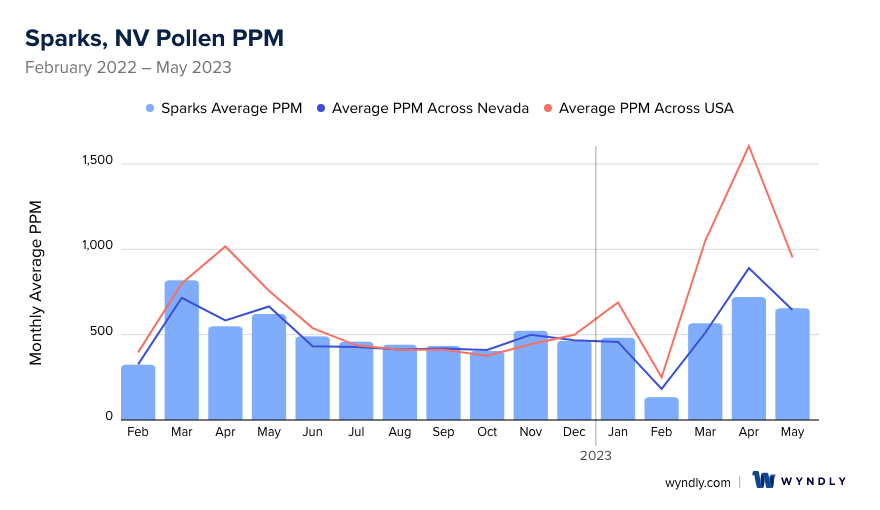
When is pollen lowest in Sparks, NV?

Green down arrow

February

Lowest month total PPM

134.04 Avg. PPM

When is pollen highest in Sparks, NV?
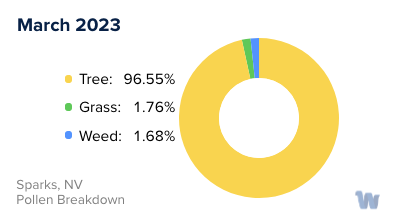
Red up arrow

March

Highest month total PPM

818.56 Avg. PPM

How does pollen in Sparks, NV compare to Nevada?

Sparks has a higher average PPM than the state of Nevada.

Sparks yearly avg PPM: 505.41

Nevada yearly avg PPM: 502.79

How does pollen in Sparks, NV compare to the USA?

Sparks has a lower average PPM than the USA.

Sparks yearly avg PPM: 505.41

USA yearly avg PPM: 664.86

Is pollen worse this year in Sparks, NV?

Spring 2023 was about the same as 2022.

Spring 2023 PPM: 1,942.05

Spring 2022 PPM: 1,988.66

Average PPM in Sparks, NV

Sparks, NV Average PPM Sparks, NV Average PPM

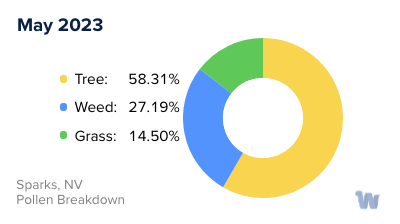
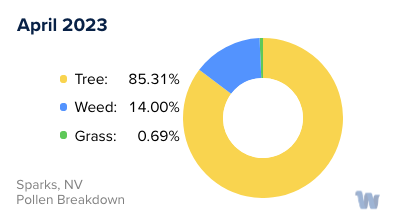
Sparks, NV Pollen and Allergy Breakdown by Month

Grass

When is grass pollen highest in Sparks, NV?

May has the highest grass pollen in Sparks, NV with an average PPM of 244.72

When is grass pollen lowest in Sparks, NV?

December has the lowest grass pollen in Sparks, NV with an average PPM of 0

Tree

When is tree pollen highest in Sparks, NV?

March has the highest tree pollen in Sparks, NV with an average PPM of 757.91

When is tree pollen lowest in Sparks, NV?

August has the lowest tree pollen in Sparks, NV with an average PPM of
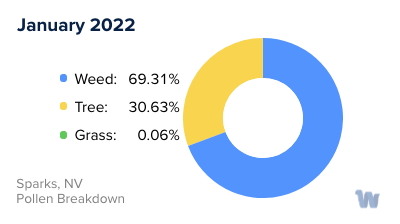
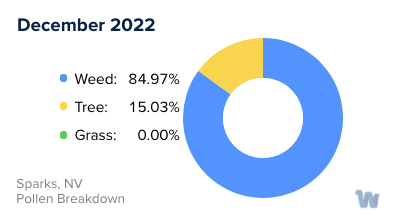
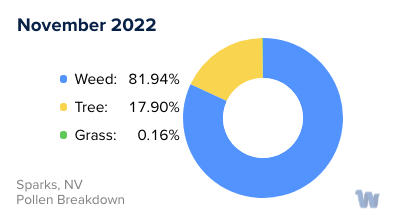
 55.71

Weed

When is weed pollen highest in Sparks, NV?

November has the highest weed pollen in Sparks, NV with an average PPM of 428.44

When is weed pollen lowest in Sparks, NV?

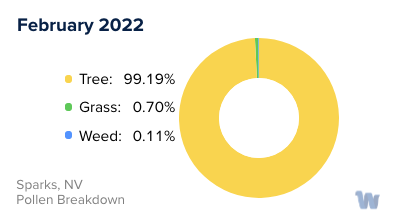
February has the lowest weed pollen in Sparks, NV with an average PPM of 0.37

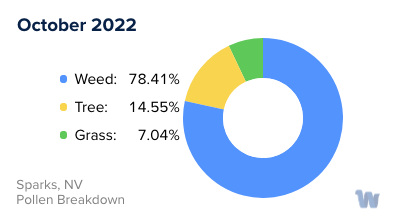
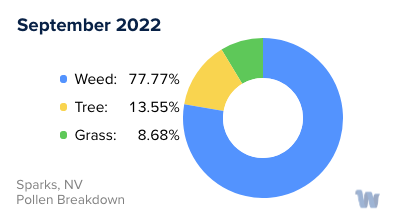
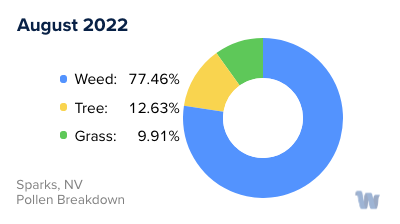
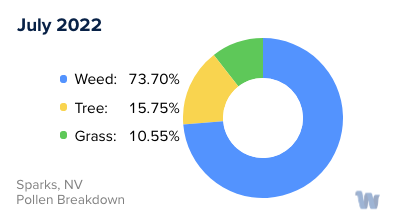
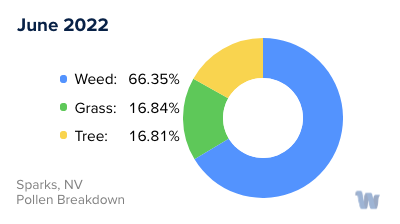
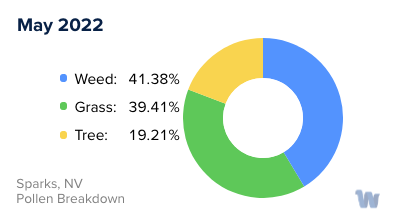
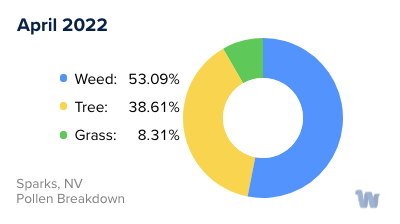
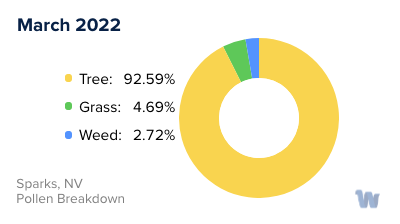
Sparks, NV Pollen Monthly Breakdown by Pollen Type

Sparks, NV Monthly Pollen Breakdown

Pollen and Hay Fever in Sparks, NV

In the city of Sparks, Nevada, people often encounter pollen allergies, also known as allergic rhinitis or hay fever. These allergies can occur seasonally or year-round, but they're most common during transitional seasons like spring when pollen is most present. More than one-quarter of all adults are affected by seasonal allergies, with women more likely to experience them than men.

The types of pollen that Sparks residents may encounter vary and can come from different sources such as trees, grass, and weeds. Specifically, the types of tree pollen found in this region include Pine, Juniper, and Oak.

The tree pollen season generally begins in early spring, followed by the grass pollen season in late spring and early summer. Finally, weed pollen, which can also cause allergic reactions, typically peaks in late summer and fall. It's important to note that the exact timing and severity of these pollen seasons can vary year by year, influenced by factors such as weather conditions and temperature variations.

Symptoms of pollen allergies typically include itchy, watery eyes, a runny or stuffy nose, sneezing, and congestion. These symptoms can significantly affect the quality of life for those affected, particularly during peak pollen seasons.

While it's not always possible to completely avoid exposure to pollen, being aware of the types of pollen present in your local area and their typical seasons can help you better understand when you might be at risk for experiencing allergy symptoms. This awareness can help individuals with allergies prepare for and manage their symptoms more effectively.

Sparks, NV Map

What is Wyndly?

Wyndly is the easiest and most convenient way to fix your allergies forever. As an online allergy practice, Wyndly offers at-home allergy testing and treatment. The main goal of Wyndly is to retrain the immune system to stop responding to allergens, providing lasting relief from allergies.

Here's how Wyndly works:

  1. Identify Allergy Triggers: The first step is to identify the allergy triggers. You can purchase an at-home allergy test from Wyndly, or if you have already done an allergy test elsewhere, you can share your existing test results. This allows the doctors at Wyndly to pinpoint which allergies need to be treated.
  2. Get Treated by a Real Doctor: Using medications that are similar to those used in allergy shots, a doctor creates a unique sublingual immunotherapy treatment plan to desensitize your immune system. This is done using FDA-approved sublingual tablets or clinically proven dosing for oral use.
  3. Live Better Without Symptoms: The prescriptions are shipped to your door, and the doctor works with you until you’re better. Wyndly offers regular online check-ins with US-licensed physicians and 24/7 availability for questions or concerns via text, email, or call.

The treatment plans are personalized based on your specific allergy triggers and aim to treat allergies at their source, rather than just relieving symptoms for a short period. Most people report improvement in as little as one month.

Start with Wyndly today

Wyndly Summer 2023 Pollen Report Methodology

For each city, Wyndly obtained monthly pollen PPMs (pollen grains per cubic meter) for each form (tree, grass, and weed) from February 2022 - May 2023. Data were obtained from Pollen Sense, LLC Automated Particulate Sensors (APS). These sensors automatically detect particulate matter collected from ambient air, and use a neural network algorithm to identify individual pollen species and calculate daily pollen counts.

Yearly averages are calculated by summing the three allergen averages per month of data for a total monthly PPM, summing all monthly total PPMs, then dividing by 12 (month count). Used for per-city average, state average, and total USA average. Season comparisons are done by summing the months of Spring (March, April, May) for 2023 and 2022. If the absolute of the (2023-2022)/2022 is ≤ 0.05, the years were about the same. Otherwise, the more PPM, the worse the season was.

Is Wyndly right for you?

Answer just a few questions and we'll help you find out.

Get Started Today

Pollen and Allergy Reports by City