Pierre, SD Pollen and Allergy Report for Summer 2023

Pollen Allergy Trends in Pierre, SD

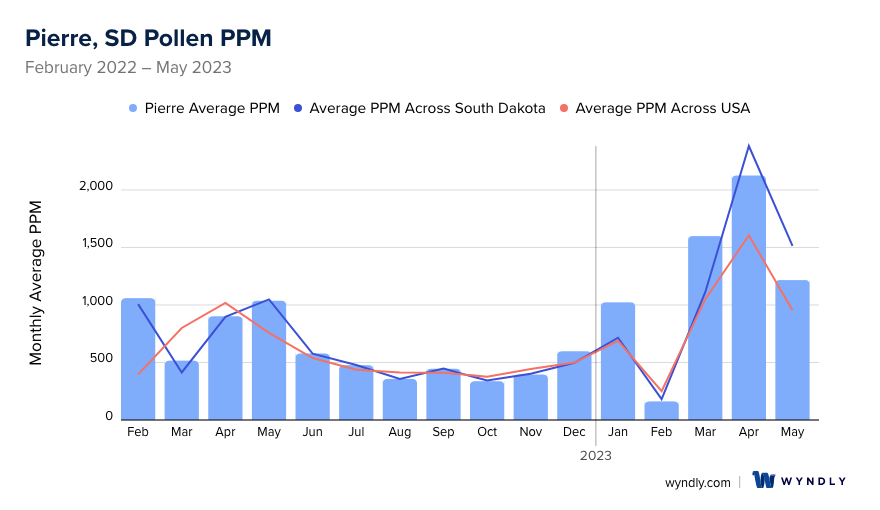
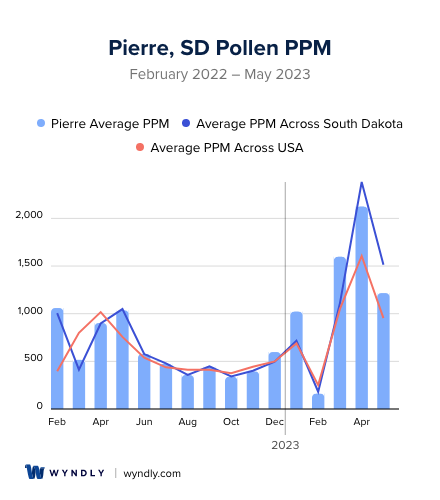
When is pollen lowest in Pierre, SD?

Green down arrow

February

Lowest month total PPM

161.69 Avg. PPM

When is pollen highest in Pierre, SD?

Red up arrow

April

Highest month total PPM

2,125.42 Avg. PPM

How does pollen in Pierre, SD compare to South Dakota?

Pierre has a higher average PPM than the state of South Dakota.

Pierre yearly avg PPM: 801.68

South Dakota yearly avg PPM: 773.14

How does pollen in Pierre, SD compare to the USA?

Pierre has a higher average PPM than the USA.

Pierre yearly avg PPM: 801.68

USA yearly avg PPM: 664.86

Is pollen worse this year in Pierre, SD?

Spring 2023 was worse than spring 2022.

Spring 2023 PPM: 4,940.16

Spring 2022 PPM: 2,454.55

Average PPM in Pierre, SD

Pierre, SD Average PPM Pierre, SD Average PPM

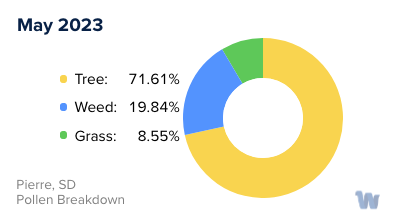
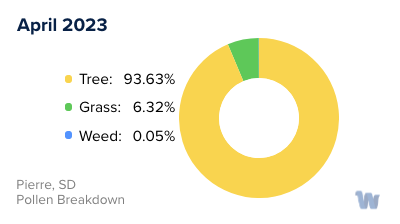
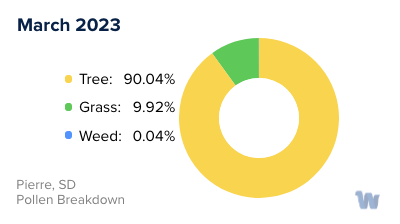
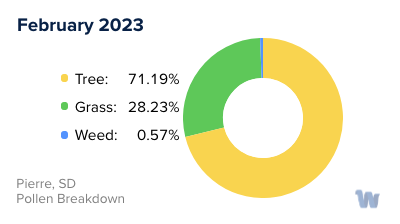
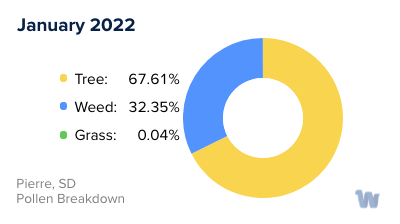
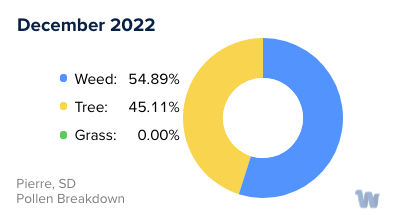
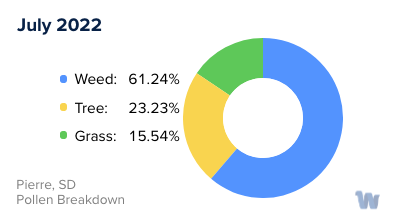
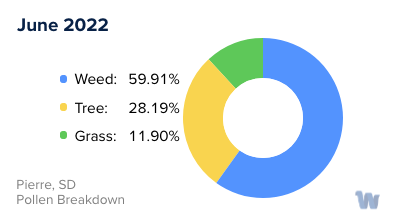
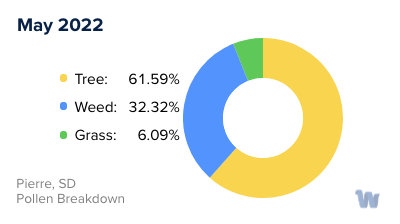
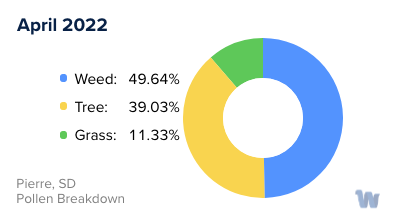
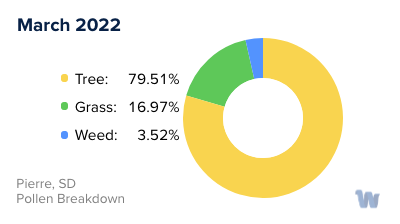
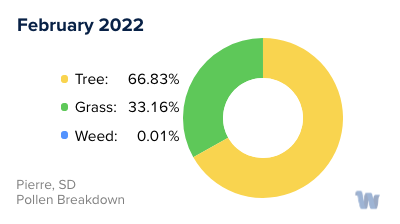
Pierre, SD Pollen and Allergy Breakdown by Month

Grass

When is grass pollen highest in Pierre, SD?

February has the highest grass pollen in Pierre, SD with an average PPM of 351.26

When is grass pollen lowest in Pierre, SD?

December has the lowest grass pollen in Pierre, SD with an average PPM of 0

Tree

When is tree pollen highest in Pierre, SD?

April has the highest tree pollen in Pierre, SD with an average PPM of 1,990.06

When is tree pollen lowest in Pierre, SD?

September has the lowest tree pollen in Pierre, SD with an average PPM of 52.6

Weed

When is weed pollen highest in Pierre, SD?

April has the highest weed pollen in Pierre, SD with an average PPM of 447.63

When is weed pollen lowest in Pierre, SD?

February has the lowest weed pollen in Pierre, SD with an average PPM of 0.08

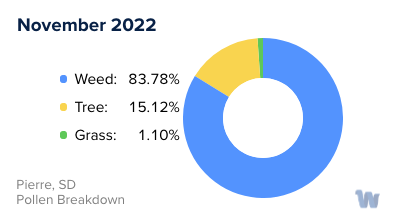
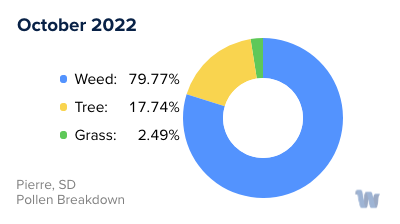
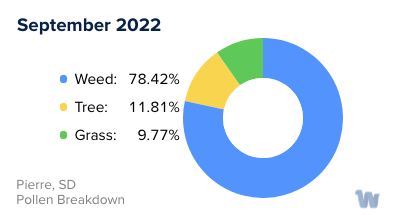
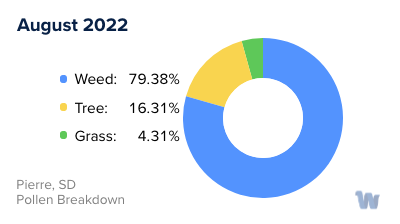
Pierre, SD Pollen Monthly Breakdown by Pollen Type

Pierre, SD Monthly Pollen Breakdown

Pollen and Hay Fever in Pierre, SD

As the residents of Pierre, South Dakota, welcome the arrival of spring, they also brace themselves for the onset of allergy season. The region's diverse flora contributes to a range of pollens that can trigger allergies and hay fever. In the early months of spring, tree pollen becomes particularly prevalent. The main culprits are the box elder, oak, maple, willow, and ash trees that add to the verdant beauty of the area but can cause discomfort to allergy sufferers.

As the weather warms and ushers in the summer months, the grasses of South Dakota burst into life. The wide-open fields and prairies become a source of pollen, with corn and prairie grass being notable contributors. These grasses, while vital for the local ecosystem and agriculture, produce pollens that can stir up allergic reactions.

With the arrival of fall, the allergy focus shifts from grass to weeds. Common weeds such as wormwood, oldman, and sagebrush become the primary pollen producers. Their tiny pollen grains can be carried for miles by the wind, making it difficult for individuals with allergies to avoid exposure.

It's important to remember that the timing and severity of pollen seasons can vary from year to year, based on factors such as weather conditions and plant growth cycles. Even within the same city, different neighborhoods can have slightly different pollen profiles due to variations in local vegetation.

Knowledge about the types of pollen and their seasons can help individuals in Pierre, South Dakota understand what might be causing their allergies and hay fever. However, it's always recommended to consult with a healthcare provider for an accurate diagnosis and advice tailored to individual circumstances.

Pierre, SD Map

What is Wyndly?

Wyndly is the easiest and most convenient way to fix your allergies forever. As an online allergy practice, Wyndly offers at-home allergy testing and treatment. The main goal of Wyndly is to retrain the immune system to stop responding to allergens, providing lasting relief from allergies.

Here's how Wyndly works:

  1. Identify Allergy Triggers: The first step is to identify the allergy triggers. You can purchase an at-home allergy test from Wyndly, or if you have already done an allergy test elsewhere, you can share your existing test results. This allows the doctors at Wyndly to pinpoint which allergies need to be treated.
  2. Get Treated by a Real Doctor: Using medications that are similar to those used in allergy shots, a doctor creates a unique sublingual immunotherapy treatment plan to desensitize your immune system. This is done using FDA-approved sublingual tablets or clinically proven dosing for oral use.
  3. Live Better Without Symptoms: The prescriptions are shipped to your door, and the doctor works with you until you’re better. Wyndly offers regular online check-ins with US-licensed physicians and 24/7 availability for questions or concerns via text, email, or call.

The treatment plans are personalized based on your specific allergy triggers and aim to treat allergies at their source, rather than just relieving symptoms for a short period. Most people report improvement in as little as one month.

Start with Wyndly today

Wyndly Summer 2023 Pollen Report Methodology

For each city, Wyndly obtained monthly pollen PPMs (pollen grains per cubic meter) for each form (tree, grass, and weed) from February 2022 - May 2023. Data were obtained from Pollen Sense, LLC Automated Particulate Sensors (APS). These sensors automatically detect particulate matter collected from ambient air, and use a neural network algorithm to identify individual pollen species and calculate daily pollen counts.

Yearly averages are calculated by summing the three allergen averages per month of data for a total monthly PPM, summing all monthly total PPMs, then dividing by 12 (month count). Used for per-city average, state average, and total USA average. Season comparisons are done by summing the months of Spring (March, April, May) for 2023 and 2022. If the absolute of the (2023-2022)/2022 is ≤ 0.05, the years were about the same. Otherwise, the more PPM, the worse the season was.

Is Wyndly right for you?

Answer just a few questions and we'll help you find out.

Get Started Today

Pollen and Allergy Reports by City