Round Rock, TX Pollen and Allergy Report for Summer 2023

Pollen Allergy Trends in Round Rock, TX
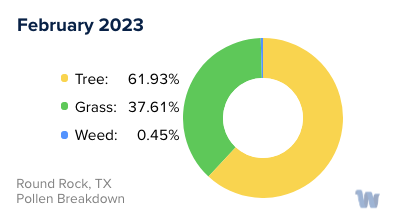
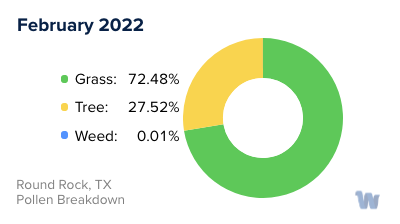
When is pollen lowest in Round Rock, TX?
February
Lowest month total PPM
Avg. PPM
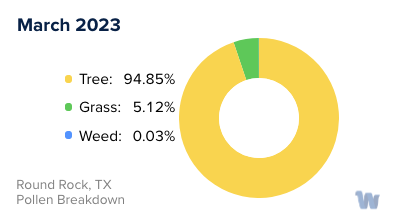
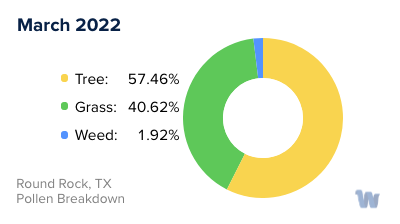
When is pollen highest in Round Rock, TX?
March
Highest month total PPM
Avg. PPM
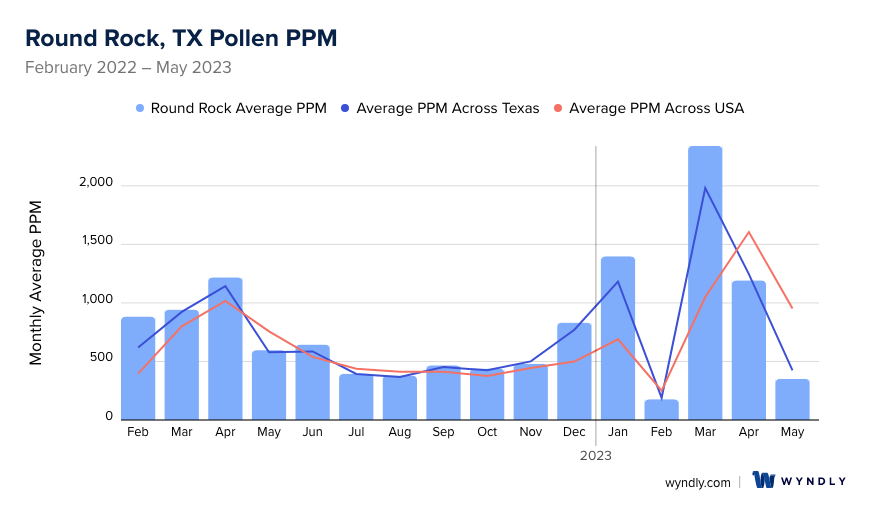
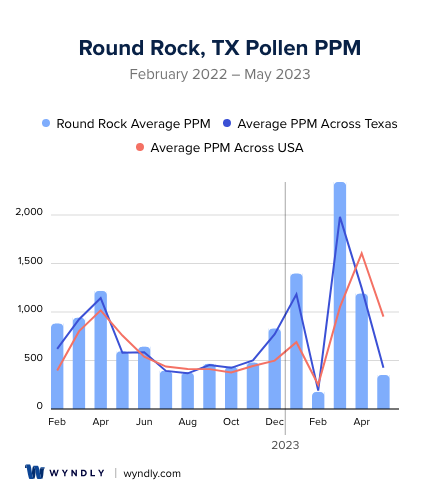
How does pollen in Round Rock, TX compare to Texas?
Round Rock has a higher average PPM than the state of Texas.
Round Rock yearly avg PPM:
Texas yearly avg PPM:
How does pollen in Round Rock, TX compare to the USA?
Round Rock has a higher average PPM than the USA.
Round Rock yearly avg PPM:
USA yearly avg PPM:
Is pollen worse this year in Round Rock, TX?
Spring 2023 was worse than spring 2022.
Spring 2023 PPM:
Spring 2022 PPM:
Average PPM in Round Rock, TX
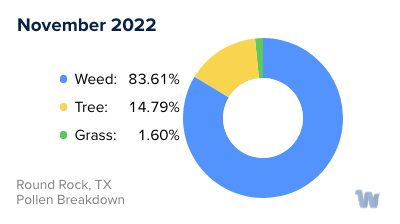
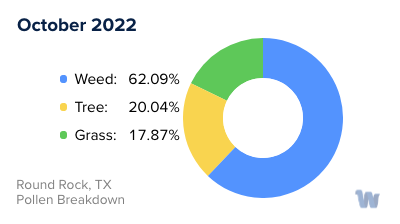
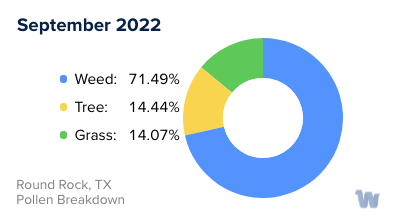
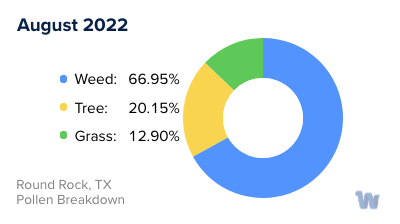
Round Rock, TX Pollen and Allergy Breakdown by Month
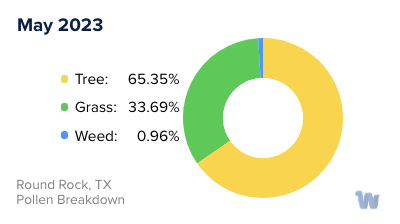
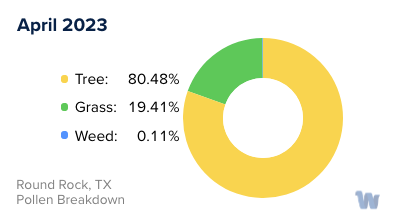
Grass
When is grass pollen highest in Round Rock, TX?
February has the highest grass pollen in Round Rock, TX with an average PPM of
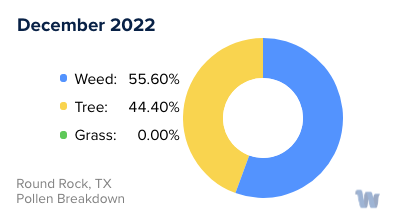
When is grass pollen lowest in Round Rock, TX?
December has the lowest grass pollen in Round Rock, TX with an average PPM of
Tree
When is tree pollen highest in Round Rock, TX?
March has the highest tree pollen in Round Rock, TX with an average PPM of
When is tree pollen lowest in Round Rock, TX?
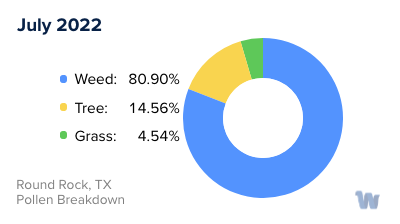
July has the lowest tree pollen in Round Rock, TX with an average PPM of
Weed
When is weed pollen highest in Round Rock, TX?
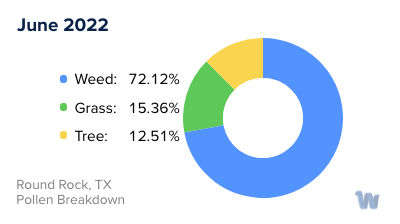
June has the highest weed pollen in Round Rock, TX with an average PPM of
When is weed pollen lowest in Round Rock, TX?
February has the lowest weed pollen in Round Rock, TX with an average PPM of
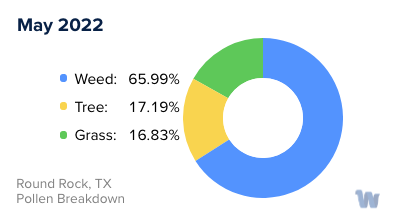
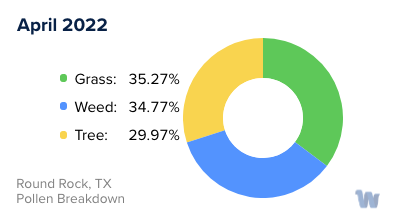
Round Rock, TX Pollen Monthly Breakdown by Pollen Type
Pollen and Hay Fever in Round Rock, TX
Round Rock, Texas, a city near Austin—often referred to as the Allergy Capital of the World—experiences a spectrum of airborne allergens throughout the year. These allergens, particularly pollens, can lead to discomfort for many individuals and may trigger conditions like hay fever, a type of allergic rhinitis.
In Round Rock, hay fever is most commonly caused by ragweed pollen, which is most abundant from mid-August to mid-November. This period, typically identified as fall, is when the ragweed plant releases its pollen into the air, making it a challenging time for those with a sensitivity to this particular pollen.
Following fall, the winter season from December to February is characterized by "Cedar Fever." Despite its name, Cedar Fever isn't a fever at all. Instead, it refers to the allergic reaction caused by the pollen from the local cedar trees.
As winter recedes, spring brings a different mix of pollens. This is the time when trees such as Oak, Elm, Pecan, and Ash release their pollen. These types of tree pollens are prevalent in the air and can cause allergic symptoms in susceptible individuals.
Apart from these seasonal pollens, Round Rock also experiences allergens from molds and grasses that persist throughout the year. These allergens can cause similar allergy symptoms and are an important consideration in the overall pollen landscape of the city.
Understanding the types of pollen and their seasons in Round Rock can help individuals better anticipate and navigate their allergies. However, it's essential to remember that the severity and timing of pollen seasons can vary from year to year due to factors like weather and climate conditions. Therefore, staying informed about local pollen forecasts can be beneficial for those who experience pollen allergies.