West Jordan, UT Pollen and Allergy Report for Summer 2023

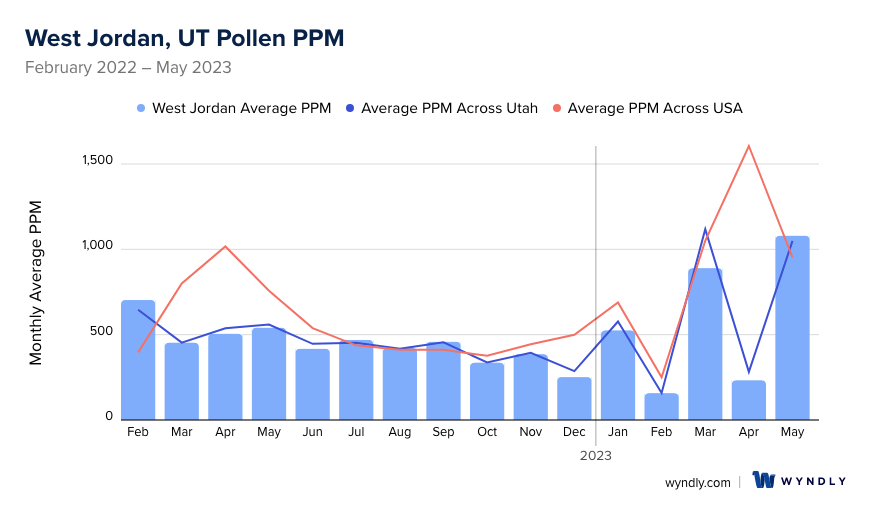
Pollen Allergy Trends in West Jordan, UT
When is pollen lowest in West Jordan, UT?
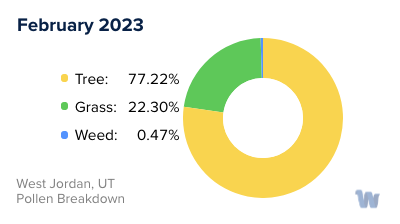
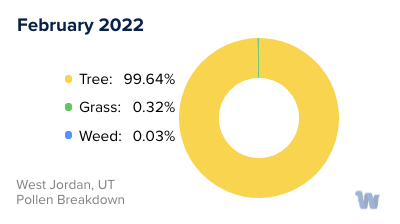
February
Lowest month total PPM
Avg. PPM
When is pollen highest in West Jordan, UT?
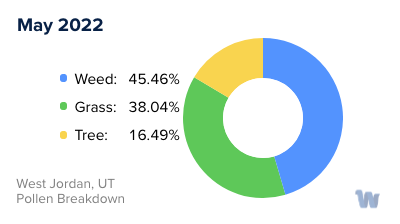
May
Highest month total PPM
Avg. PPM
How does pollen in West Jordan, UT compare to Utah?
West Jordan has a lower average PPM than the state of Utah.
West Jordan yearly avg PPM:
Utah yearly avg PPM:
How does pollen in West Jordan, UT compare to the USA?
West Jordan has a lower average PPM than the USA.
West Jordan yearly avg PPM:
USA yearly avg PPM:
Is pollen worse this year in West Jordan, UT?
Spring 2023 was worse than spring 2022.
Spring 2023 PPM:
Spring 2022 PPM:
Average PPM in West Jordan, UT

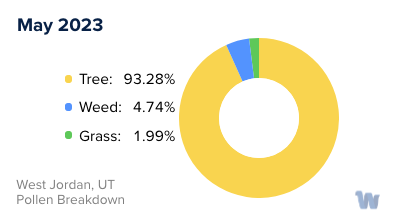
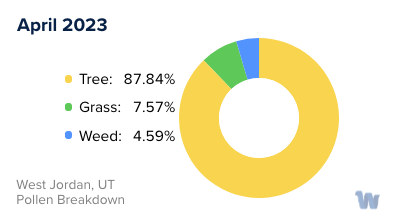
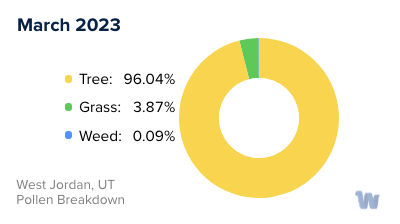
West Jordan, UT Pollen and Allergy Breakdown by Month
Grass
When is grass pollen highest in West Jordan, UT?
May has the highest grass pollen in West Jordan, UT with an average PPM of
When is grass pollen lowest in West Jordan, UT?
November has the lowest grass pollen in West Jordan, UT with an average PPM of
Tree
When is tree pollen highest in West Jordan, UT?
May has the highest tree pollen in West Jordan, UT with an average PPM of
When is tree pollen lowest in West Jordan, UT?
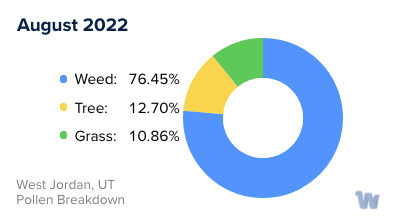
August has the lowest tree pollen in West Jordan, UT with an average PPM of
Weed
When is weed pollen highest in West Jordan, UT?
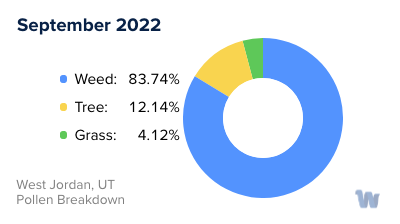
September has the highest weed pollen in West Jordan, UT with an average PPM of
When is weed pollen lowest in West Jordan, UT?
February has the lowest weed pollen in West Jordan, UT with an average PPM of
West Jordan, UT Pollen Monthly Breakdown by Pollen Type

Pollen and Hay Fever in West Jordan, UT
In the picturesque West Jordan, Utah, nestled between the Oquirrh Mountains and the Jordan River, pollen allergies and hay fever are an annual encounter for many residents. These allergies, often collectively referred to as “hay fever”, are triggered by airborne pollen grains. During spring, summer, and early fall, different plants release pollen into the air, which can cause a variety of symptoms in allergy-prone individuals.
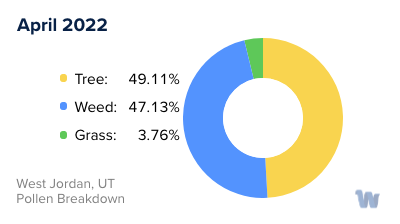
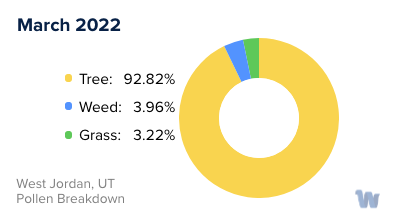
In West Jordan, trees such as cottonwood, oak, and cedar generally begin releasing pollen in the spring. These tiny, lightweight pollen grains are easily carried by the wind, and can find their way into your nose and throat, causing sneezing, congestion, and itchy eyes. As spring transitions into summer, grasses take center stage. Bermuda grass, Kentucky bluegrass, and ryegrasses are some of the common culprits in West Jordan. Their pollen levels usually peak in the late spring and early summer.
As the seasons change, the types of pollen in the air shift as well. By the time fall rolls around, it's the weeds that are mainly responsible for hay fever in West Jordan. Ragweed is a particularly notorious offender. Others include sagebrush and chenopods.
The quantity and types of pollen in the air also depend on various environmental factors such as weather conditions and rainfall. West Jordan, with its varying elevations and microclimates, can experience diverse pollen counts even within the city. It's important for residents to be aware of the different types of pollen and the seasons in which they are prevalent, in order to better understand what might be causing their hay fever symptoms.
In summary, pollen allergies in West Jordan are influenced by a medley of trees, grasses, and weeds, with each having its own pollen season. Being knowledgeable about these patterns can help residents in better managing their hay fever during different times of the year.