Renton, WA Pollen and Allergy Report for Summer 2023

Pollen Allergy Trends in Renton, WA
When is pollen lowest in Renton, WA?
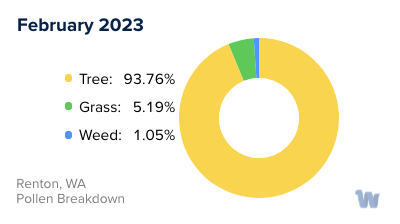
February
Lowest month total PPM
Avg. PPM
When is pollen highest in Renton, WA?
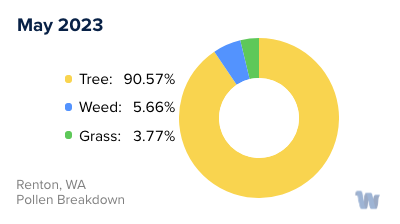
May
Highest month total PPM
Avg. PPM
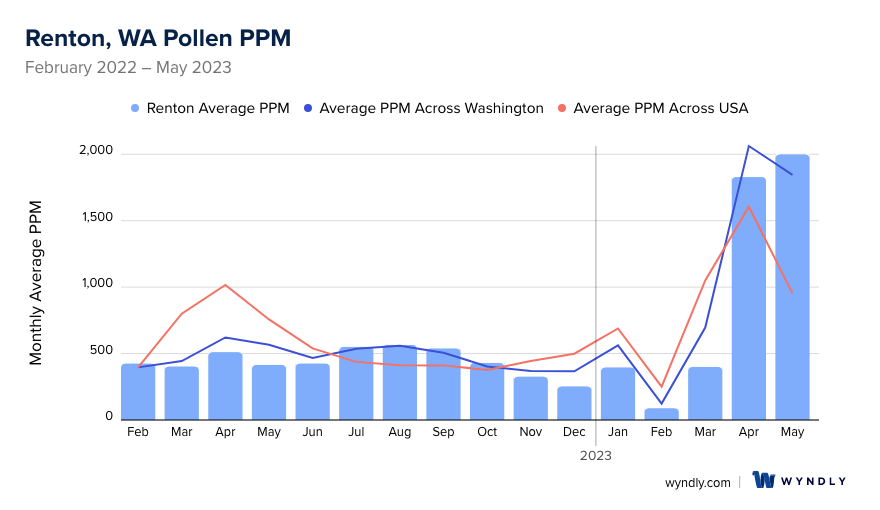
How does pollen in Renton, WA compare to Washington?
Renton has a lower average PPM than the state of Washington.
Renton yearly avg PPM:
Washington yearly avg PPM:
How does pollen in Renton, WA compare to the USA?
Renton has a lower average PPM than the USA.
Renton yearly avg PPM:
USA yearly avg PPM:
Is pollen worse this year in Renton, WA?
Spring 2023 was worse than spring 2022.
Spring 2023 PPM:
Spring 2022 PPM:
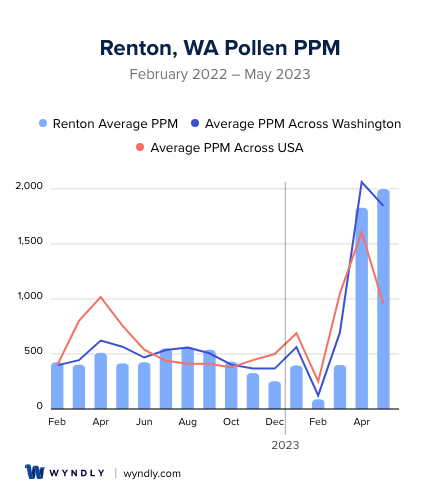
Average PPM in Renton, WA
Renton, WA Pollen and Allergy Breakdown by Month
Grass
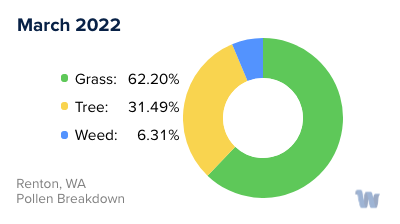
When is grass pollen highest in Renton, WA?
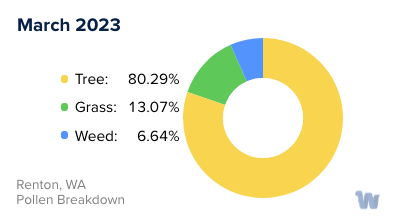
March has the highest grass pollen in Renton, WA with an average PPM of
When is grass pollen lowest in Renton, WA?
November has the lowest grass pollen in Renton, WA with an average PPM of
Tree
When is tree pollen highest in Renton, WA?
May has the highest tree pollen in Renton, WA with an average PPM of
When is tree pollen lowest in Renton, WA?
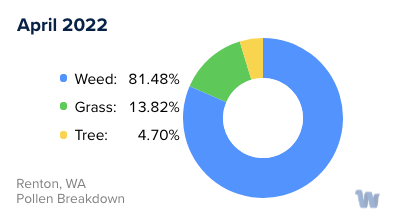
April has the lowest tree pollen in Renton, WA with an average PPM of
Weed
When is weed pollen highest in Renton, WA?
August has the highest weed pollen in Renton, WA with an average PPM of
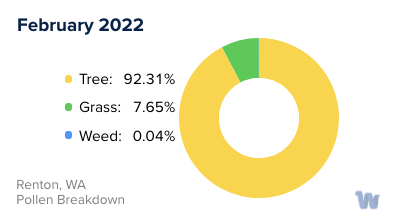
When is weed pollen lowest in Renton, WA?
February has the lowest weed pollen in Renton, WA with an average PPM of
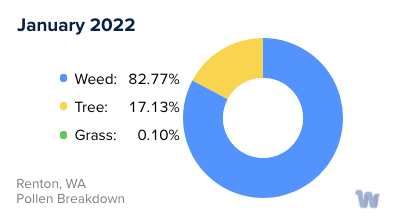
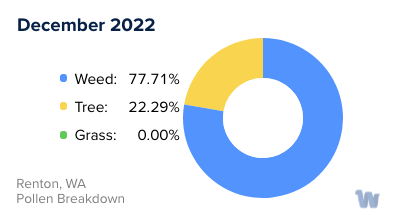
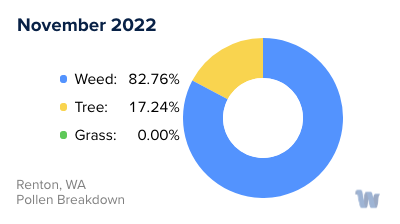
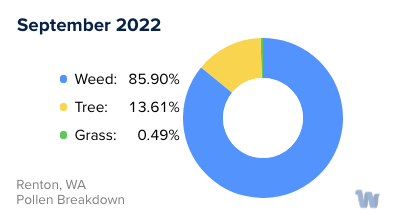
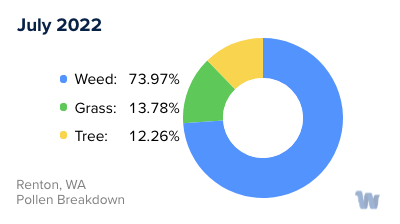
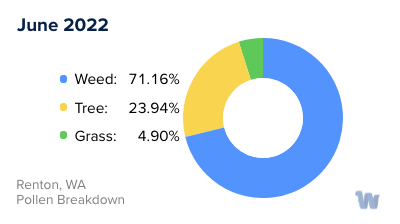
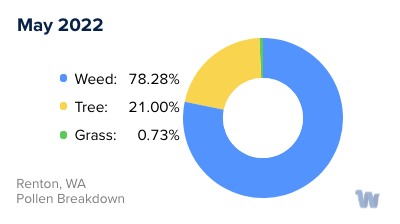
Renton, WA Pollen Monthly Breakdown by Pollen Type


Pollen and Hay Fever in Renton, WA
In the welcoming city of Renton, Washington, the beauty of the changing seasons comes with a less welcome guest: pollen allergies. Here, a variety of trees, grasses, and weeds play their part in the annual cycle of pollen production, each contributing to the overall allergen count at different times of the year.
Tree pollen, specifically from cedar and juniper trees, tends to be the primary culprit during the spring months. These trees start releasing their pollen as early as February, marking the beginning of the allergy season. As we move into April and May, the pollen count often reaches its peak. It's during these months that residents might find themselves experiencing the most pronounced symptoms of hay fever, which include sneezing, runny nose, and itchy eyes.
When summer rolls around, grasses take center stage. Grass pollen, produced by a variety of species including ryegrass, Bermuda grass, orchard grass, redtop grass, and Johnson grass, is most prevalent during the warm summer months. These grasses adorn many of the beautiful landscapes of Renton, making summer a time of high pollen activity.
The transition into the fall doesn't necessarily bring relief. This is the time when weeds such as ragweed, Russian thistle, and pigweed step in to continue the cycle of pollen production. These weed pollens persist into late summer and continue up until the end of the allergy season, making autumn another challenging time for those prone to pollen allergies.
In addition to the cedar and juniper trees, there are other tree species like alder, willow, oak, and birch trees that can cause allergies. However, these species' pollen levels and impacts can vary, and not everyone will be sensitive to all types of pollen.
Although the allergen count can be high during certain times of the year, Renton's beautiful green spaces and outdoor activities continue to draw residents and visitors alike. Awareness and understanding of Renton's pollen seasons can help residents enjoy their time outdoors while managing their symptoms. It's always a good idea to keep an eye on the local pollen count, especially during the peak months of April, May, and September.