Tacoma, WA Pollen and Allergy Report for Summer 2023

Pollen Allergy Trends in Tacoma, WA

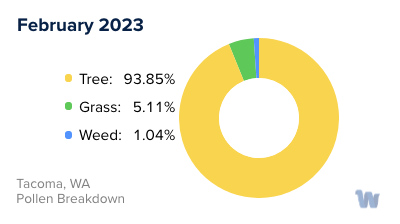
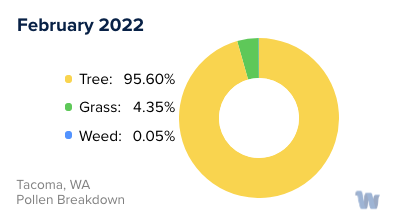
When is pollen lowest in Tacoma, WA?

Green down arrow

February

Lowest month total PPM

87.56 Avg. PPM

When is pollen highest in Tacoma, WA?
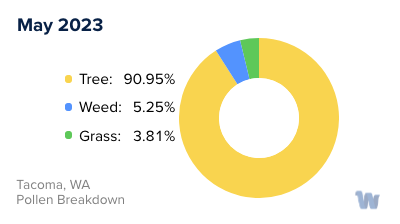
Red up arrow

May

Highest month total PPM

2,007.03 Avg. PPM

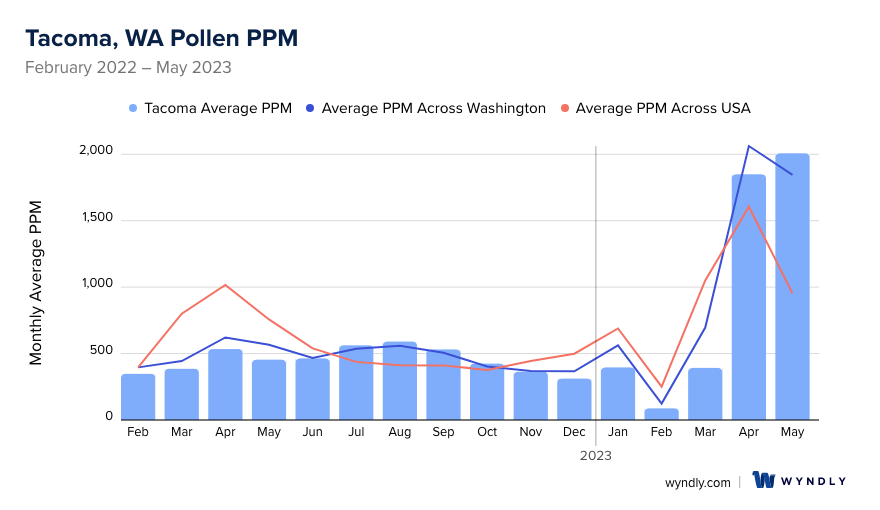
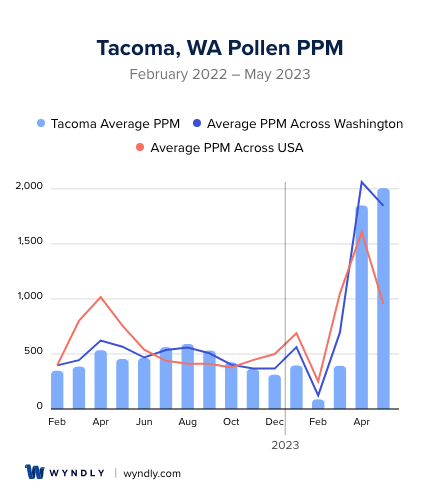
How does pollen in Tacoma, WA compare to Washington?

Tacoma has a lower average PPM than the state of Washington.

Tacoma yearly avg PPM: 606.25

Washington yearly avg PPM: 657.62

How does pollen in Tacoma, WA compare to the USA?

Tacoma has a lower average PPM than the USA.

Tacoma yearly avg PPM: 606.25

USA yearly avg PPM: 664.86

Is pollen worse this year in Tacoma, WA?

Spring 2023 was worse than spring 2022.

Spring 2023 PPM: 4,248.44

Spring 2022 PPM: 1,373.41

Average PPM in Tacoma, WA

Tacoma, WA Average PPM Tacoma, WA Average PPM

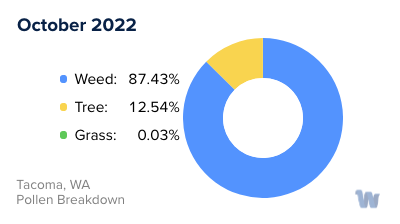
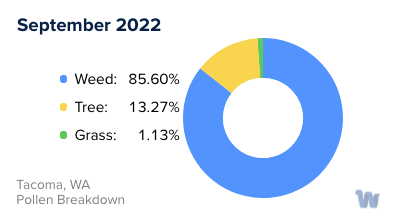
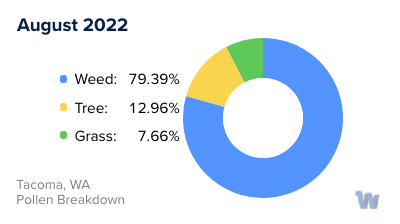
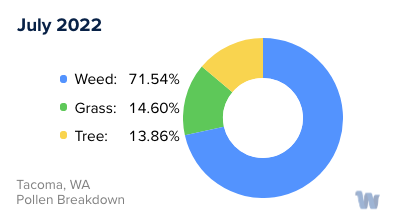
Tacoma, WA Pollen and Allergy Breakdown by Month

Grass

When is grass pollen highest in Tacoma, WA?

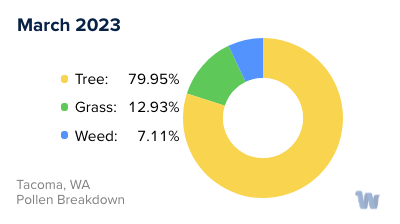
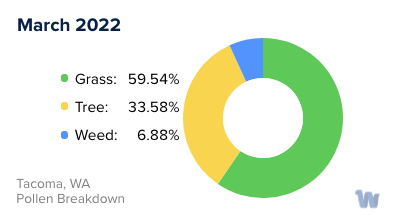
March has the highest grass pollen in Tacoma, WA with an average PPM of 229.49

When is grass pollen lowest in Tacoma, WA?

November has the lowest grass pollen in Tacoma, WA with an average PPM of 0

Tree

When is tree pollen highest in Tacoma, WA?

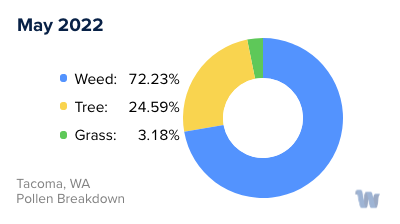
May has the highest tree pollen in Tacoma, WA with an average PPM of 1,825.33

When is tree pollen lowest in Tacoma, WA?

April has the lowest tree pollen in Tacoma, WA with an average PPM of 39.47

Weed

When is weed pollen highest in Tacoma, WA?

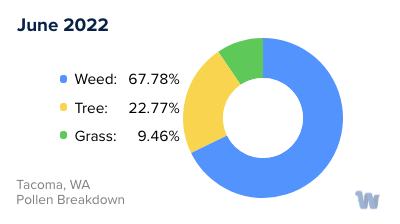
August has the highest weed pollen in Tacoma, WA with an average PPM of 468.74

When is weed pollen lowest in Tacoma, WA?

February has the lowest weed pollen in Tacoma, WA with an average PPM of 0.19

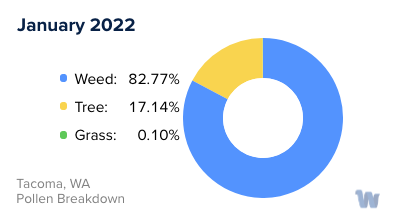
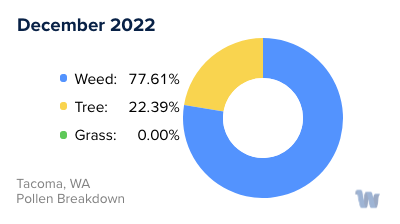
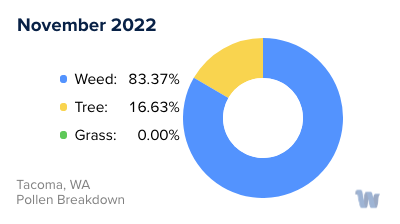
Tacoma, WA Pollen Monthly Breakdown by Pollen Type

Tacoma, WA Monthly Pollen Breakdown

Pollen and Hay Fever in Tacoma, WA

In the picturesque city of Tacoma, Washington, residents enjoy the beauty of nature as it changes through the seasons. However, with this natural beauty comes the less enchanting side of seasonal pollen allergies, commonly known as hay fever. During spring and summer, trees, grasses, and weeds release tiny grains of pollen into the air. These minuscule particles can cause an array of symptoms, such as sneezing, itchy eyes, and a runny nose, that often make outdoor activities less enjoyable for allergy sufferers.

In Tacoma, tree pollen is particularly prevalent in the spring. Alder, cedar, and pine trees are common culprits. Their pollen counts can be especially high during March and April. As spring transitions into summer, grass pollen takes center stage. Residents may notice that lawns and fields throughout the city become lush and verdant. This is when grasses such as ryegrass and Kentucky bluegrass release their pollen, usually peaking in late May and June.

As summer wanes and gives way to fall, weed pollen emerges as the primary allergen. Ragweed is a notorious offender, as it can release a staggering amount of pollen into the air. In Tacoma, this typically occurs in late August and September.

Though the air is crisper and the leaves are falling, the pollen count doesn’t drop to zero in the autumn. Molds, which are not pollens but can cause similar allergic reactions, are more common during this time. Fallen leaves provide the perfect breeding ground for molds.

It's important for residents of Tacoma to be aware of these pollen seasons, as understanding the sources of these allergens can help in managing daily activities and maintaining a good quality of life amidst the stunning scenery that Tacoma has to offer.

Tacoma, WA Map

What is Wyndly?

Wyndly is the easiest and most convenient way to fix your allergies forever. As an online allergy practice, Wyndly offers at-home allergy testing and treatment. The main goal of Wyndly is to retrain the immune system to stop responding to allergens, providing lasting relief from allergies.

Here's how Wyndly works:

  1. Identify Allergy Triggers: The first step is to identify the allergy triggers. You can purchase an at-home allergy test from Wyndly, or if you have already done an allergy test elsewhere, you can share your existing test results. This allows the doctors at Wyndly to pinpoint which allergies need to be treated.
  2. Get Treated by a Real Doctor: Using medications that are similar to those used in allergy shots, a doctor creates a unique sublingual immunotherapy treatment plan to desensitize your immune system. This is done using FDA-approved sublingual tablets or clinically proven dosing for oral use.
  3. Live Better Without Symptoms: The prescriptions are shipped to your door, and the doctor works with you until you’re better. Wyndly offers regular online check-ins with US-licensed physicians and 24/7 availability for questions or concerns via text, email, or call.

The treatment plans are personalized based on your specific allergy triggers and aim to treat allergies at their source, rather than just relieving symptoms for a short period. Most people report improvement in as little as one month.

Start with Wyndly today

Wyndly Summer 2023 Pollen Report Methodology

For each city, Wyndly obtained monthly pollen PPMs (pollen grains per cubic meter) for each form (tree, grass, and weed) from February 2022 - May 2023. Data were obtained from Pollen Sense, LLC Automated Particulate Sensors (APS). These sensors automatically detect particulate matter collected from ambient air, and use a neural network algorithm to identify individual pollen species and calculate daily pollen counts.

Yearly averages are calculated by summing the three allergen averages per month of data for a total monthly PPM, summing all monthly total PPMs, then dividing by 12 (month count). Used for per-city average, state average, and total USA average. Season comparisons are done by summing the months of Spring (March, April, May) for 2023 and 2022. If the absolute of the (2023-2022)/2022 is ≤ 0.05, the years were about the same. Otherwise, the more PPM, the worse the season was.

Is Wyndly right for you?

Answer just a few questions and we'll help you find out.

Get Started Today

Pollen and Allergy Reports by City