Vancouver, WA Pollen and Allergy Report for Summer 2023

Pollen Allergy Trends in Vancouver, WA
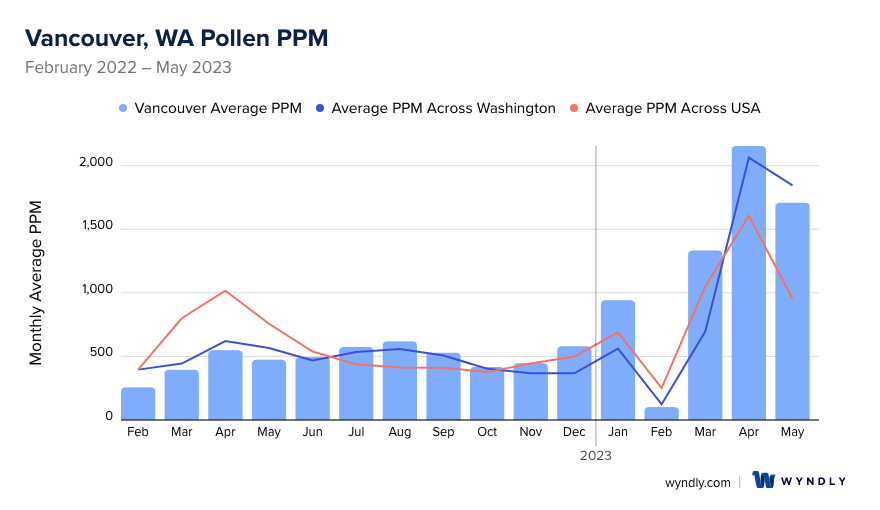
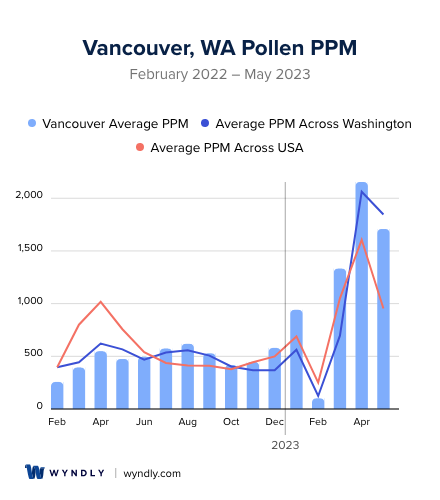
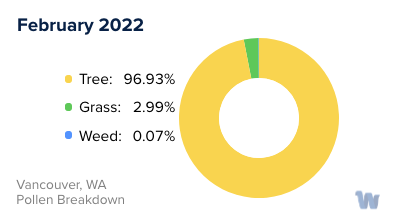
When is pollen lowest in Vancouver, WA?
February
Lowest month total PPM
Avg. PPM
When is pollen highest in Vancouver, WA?
April
Highest month total PPM
Avg. PPM
How does pollen in Vancouver, WA compare to Washington?
Vancouver has a higher average PPM than the state of Washington.
Vancouver yearly avg PPM:
Washington yearly avg PPM:
How does pollen in Vancouver, WA compare to the USA?
Vancouver has a higher average PPM than the USA.
Vancouver yearly avg PPM:
USA yearly avg PPM:
Is pollen worse this year in Vancouver, WA?
Spring 2023 was worse than spring 2022.
Spring 2023 PPM:
Spring 2022 PPM:
Average PPM in Vancouver, WA
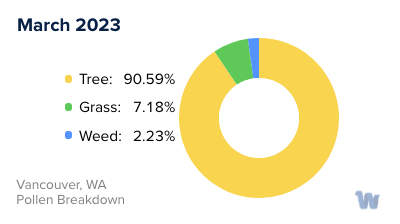
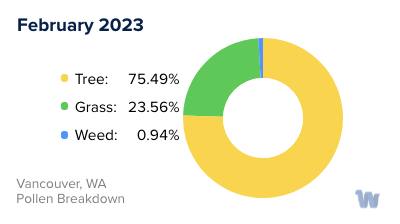
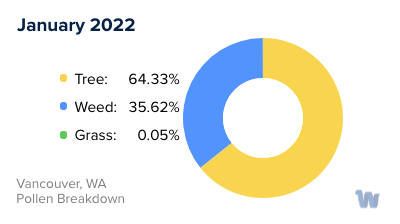
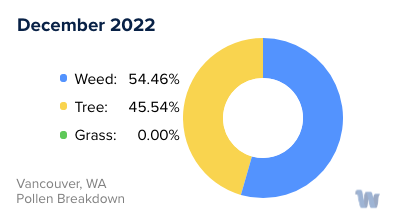
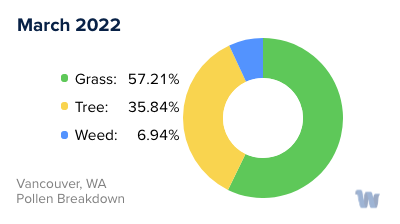
Vancouver, WA Pollen and Allergy Breakdown by Month
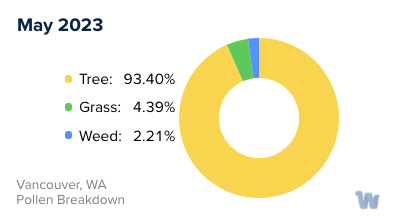
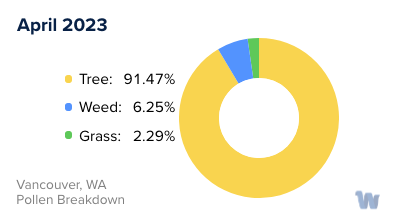
Grass
When is grass pollen highest in Vancouver, WA?
March has the highest grass pollen in Vancouver, WA with an average PPM of
When is grass pollen lowest in Vancouver, WA?
December has the lowest grass pollen in Vancouver, WA with an average PPM of
Tree
When is tree pollen highest in Vancouver, WA?
April has the highest tree pollen in Vancouver, WA with an average PPM of
When is tree pollen lowest in Vancouver, WA?
April has the lowest tree pollen in Vancouver, WA with an average PPM of
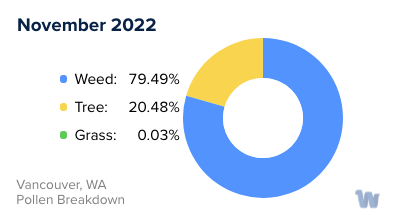
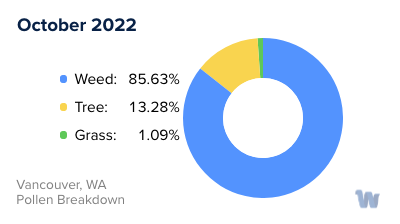
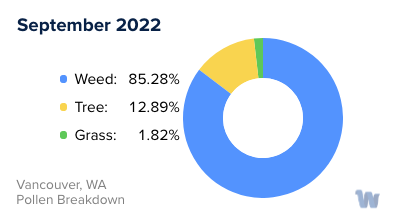
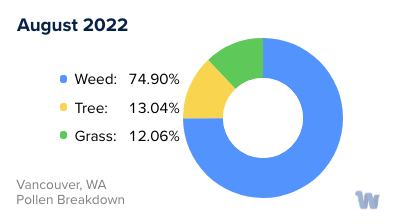
Weed
When is weed pollen highest in Vancouver, WA?
August has the highest weed pollen in Vancouver, WA with an average PPM of
When is weed pollen lowest in Vancouver, WA?
February has the lowest weed pollen in Vancouver, WA with an average PPM of
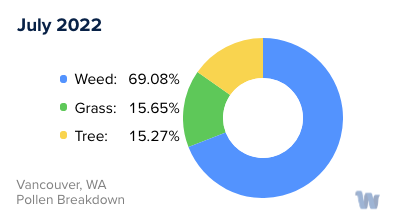
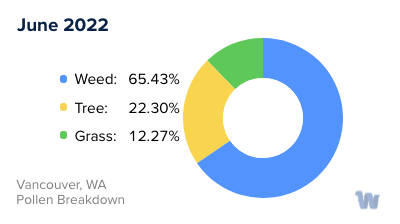
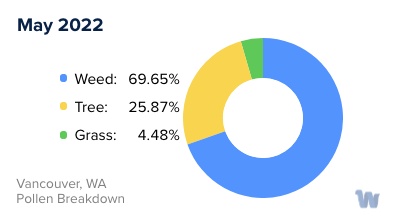
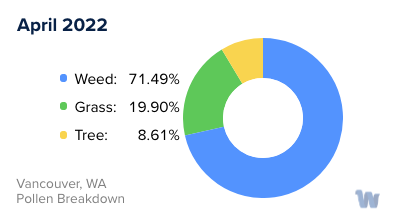
Vancouver, WA Pollen Monthly Breakdown by Pollen Type
Pollen and Hay Fever in Vancouver, WA
In the picturesque city of Vancouver, Washington, residents and visitors are blessed with a vibrant array of flora. However, with nature's beauty comes pollen, a common culprit for seasonal allergies, also known as hay fever. While the city is loved for its green spaces, those who are sensitive to pollen might experience sneezing, itchy eyes, and a runny nose during certain times of the year.
There are three primary types of pollen that trigger allergies in Vancouver. The first is tree pollen, which is typically most abundant in the spring. Trees such as alder, cedar, and pine release microscopic grains into the air, which can cause discomfort for allergy sufferers.
The second type of pollen originates from grasses. Grass pollen season usually peaks in late spring and early summer. In Vancouver, common grasses like Kentucky bluegrass, ryegrass, and fescues contribute to the pollen count. These grasses are often found in parks and lawns across the city, and their pollen is light and easily carried by the wind.
Finally, weed pollen takes center stage in late summer and fall. In Vancouver, ragweed is the most notorious weed for producing allergy-inducing pollen. In addition, other weeds like sagebrush and nettles also release pollen during this period.
It’s important to note that while these are the general trends, weather conditions can impact pollen levels. For example, a wet spring may delay the release of tree pollen, while a warm fall might extend the weed pollen season.
In conclusion, living in Vancouver, Washington, means embracing nature, but also being mindful of pollen allergies. Recognizing the types of pollen and their respective seasons can help residents and visitors anticipate and understand the causes of their hay fever symptoms, making it easier to fully enjoy the stunning environment that Vancouver has to offer.