Rockford, IL Pollen and Allergy Report for Summer 2023

Pollen Allergy Trends in Rockford, IL
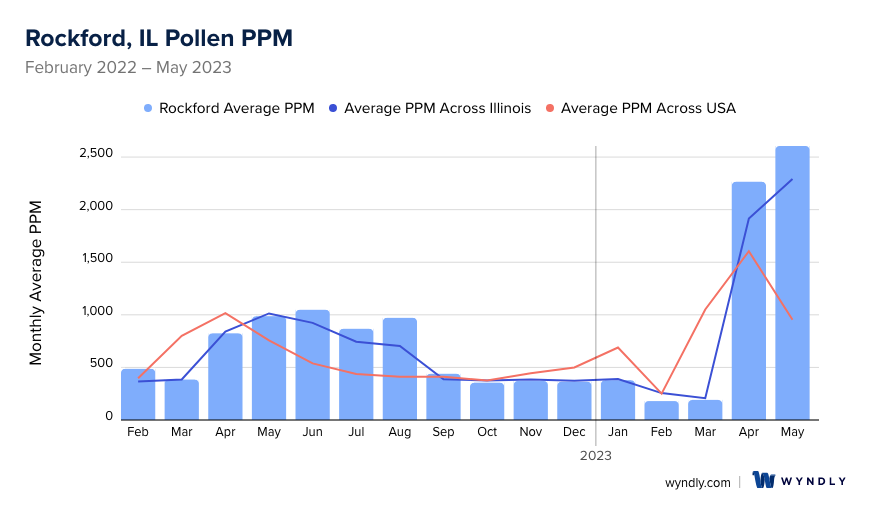
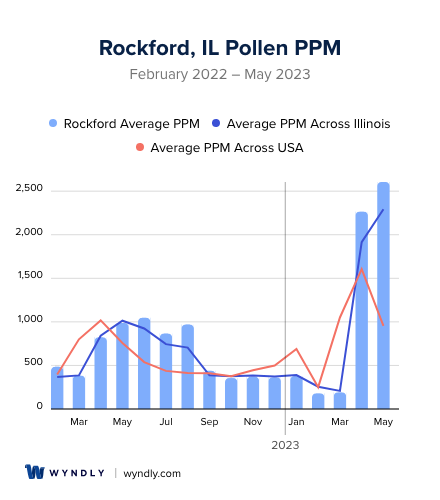
When is pollen lowest in Rockford, IL?
February
Lowest month total PPM
Avg. PPM
When is pollen highest in Rockford, IL?
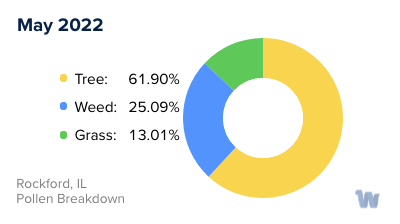
May
Highest month total PPM
Avg. PPM
How does pollen in Rockford, IL compare to Illinois?
Rockford has a higher average PPM than the state of Illinois.
Rockford yearly avg PPM:
Illinois yearly avg PPM:
How does pollen in Rockford, IL compare to the USA?
Rockford has a higher average PPM than the USA.
Rockford yearly avg PPM:
USA yearly avg PPM:
Is pollen worse this year in Rockford, IL?
Spring 2023 was worse than spring 2022.
Spring 2023 PPM:
Spring 2022 PPM:
Average PPM in Rockford, IL
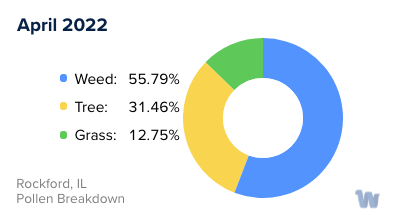
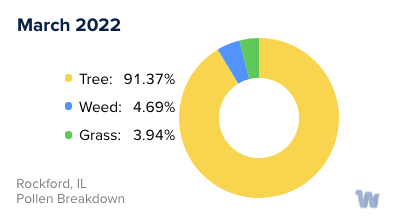
Rockford, IL Pollen and Allergy Breakdown by Month
Grass
When is grass pollen highest in Rockford, IL?
July has the highest grass pollen in Rockford, IL with an average PPM of
When is grass pollen lowest in Rockford, IL?
October has the lowest grass pollen in Rockford, IL with an average PPM of
Tree
When is tree pollen highest in Rockford, IL?
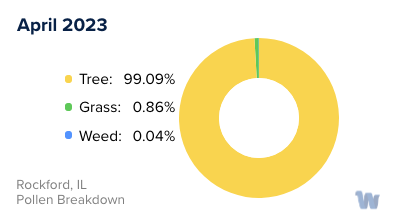
April has the highest tree pollen in Rockford, IL with an average PPM of
When is tree pollen lowest in Rockford, IL?
October has the lowest tree pollen in Rockford, IL with an average PPM of
Weed
When is weed pollen highest in Rockford, IL?
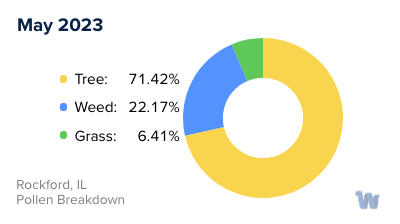
May has the highest weed pollen in Rockford, IL with an average PPM of
When is weed pollen lowest in Rockford, IL?
February has the lowest weed pollen in Rockford, IL with an average PPM of
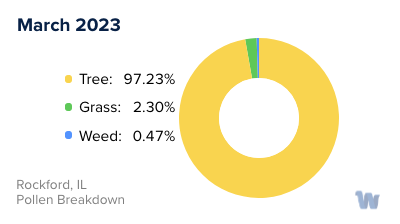
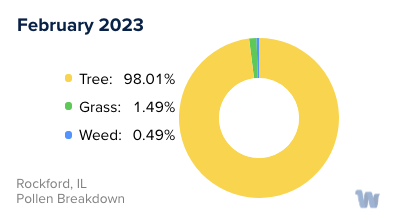
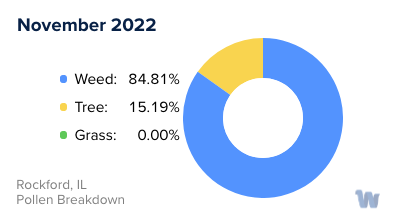
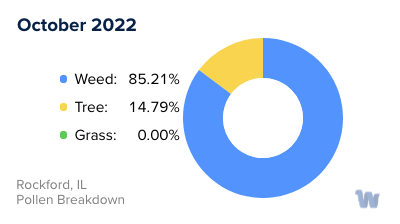
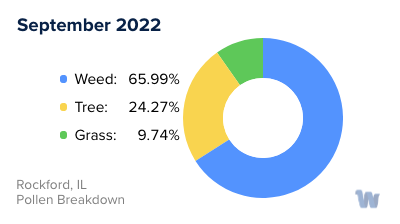
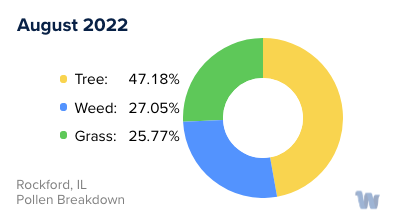
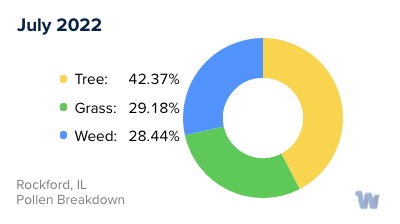
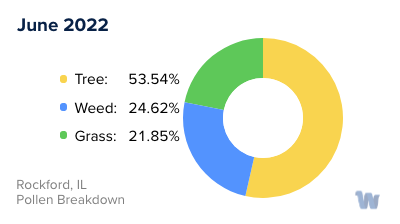
Rockford, IL Pollen Monthly Breakdown by Pollen Type


Pollen and Hay Fever in Rockford, IL
In the heart of the Midwest, Rockford, Illinois, presents a unique blend of seasonal allergies that residents often navigate. The primary culprits for these allergies are pollen, produced by grasses, trees, and weeds. While seasonal allergies are a common concern in many parts of the United States, the timeline and severity can vary depending on the region. In Rockford, the allergy season typically begins in late February or March, offering a bit of respite compared to many other states where the season starts earlier.
Throughout the year, residents of Rockford find themselves dealing with different types of pollen. Spring is the time when tree pollen begins to make its presence felt. As the season shifts towards summer, grasses take the center stage, releasing copious amounts of pollen. The list of grasses includes Ryegrass, Bermuda grass, Timothy grass, and Prairie grass. As summer gives way to fall, it's the turn of weed pollen to be in the limelight, with the likes of Ragweed, Wormwood, Orache, Pigweed, and Sagebrush being some of the common allergens.
April, May, June, and September are the months when residents need to be most vigilant, as these are the peak times for seasonal allergies. Although allergy season typically ends with the first frost of winter, indoor allergies caused by factors like dust and pet dander can still pose problems, especially given the considerable amount of time residents spend indoors due to Illinois's cold winters.
The role of trees in pollen allergies shouldn't be underestimated. Several tree species in Rockford, including Hickory, Ash, Cedar, Mulberry, and Walnut, are known to produce pollen that can trigger allergies. Each type of pollen brings with it a distinct set of challenges, making it essential for residents to understand and anticipate the different allergy seasons.
Living in Rockford, Illinois, means adapting to these seasonal rhythms, understanding the allergens prevalent in each season, and taking necessary precautions to manage symptoms. By doing so, residents can enjoy the city's beautiful landscapes and outdoor activities without letting pollen allergies hamper their experiences.