Stockton, CA Pollen and Allergy Report for Summer 2023

Pollen Allergy Trends in Stockton, CA
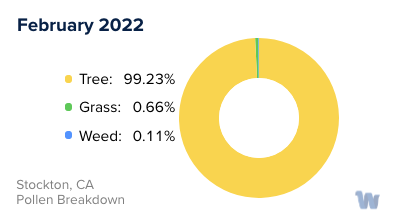
When is pollen lowest in Stockton, CA?
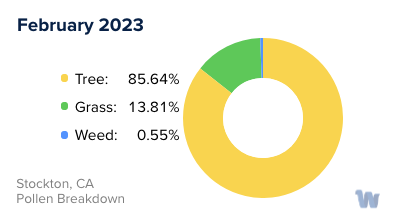
February
Lowest month total PPM
Avg. PPM
When is pollen highest in Stockton, CA?
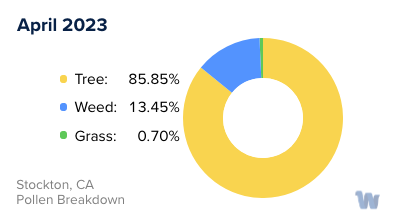
April
Highest month total PPM
Avg. PPM
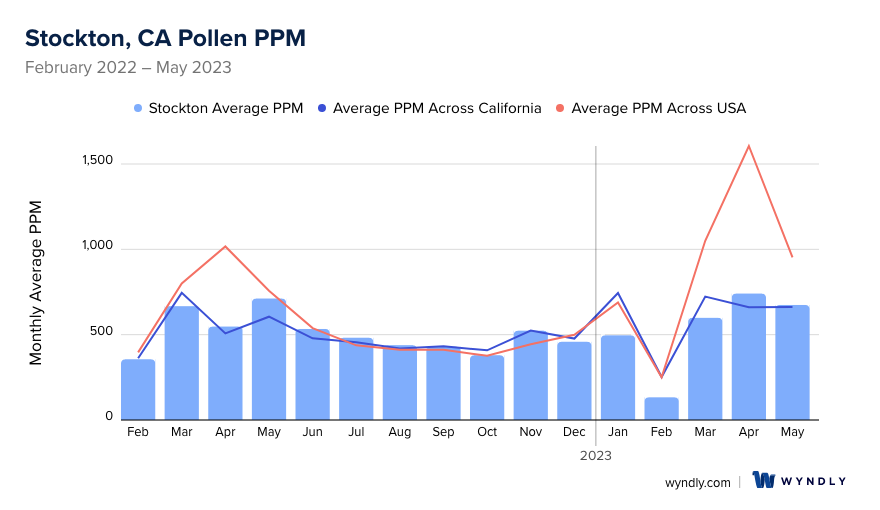
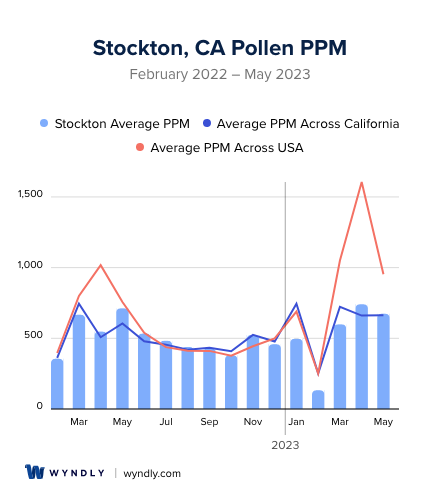
How does pollen in Stockton, CA compare to California?
Stockton has a lower average PPM than the state of California.
Stockton yearly avg PPM:
California yearly avg PPM:
How does pollen in Stockton, CA compare to the USA?
Stockton has a lower average PPM than the USA.
Stockton yearly avg PPM:
USA yearly avg PPM:
Is pollen worse this year in Stockton, CA?
Spring 2023 was about the same as 2022.
Spring 2023 PPM:
Spring 2022 PPM:
Average PPM in Stockton, CA
Stockton, CA Pollen and Allergy Breakdown by Month
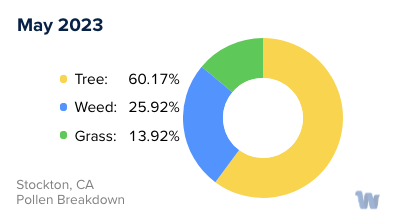
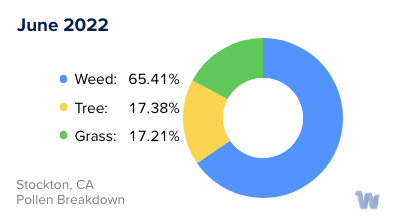
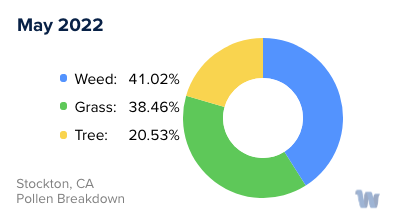
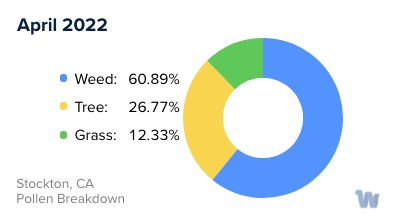
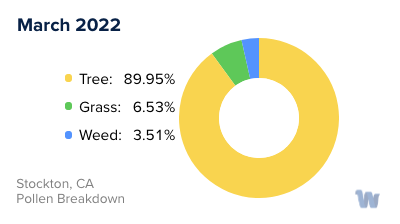
Grass
When is grass pollen highest in Stockton, CA?
May has the highest grass pollen in Stockton, CA with an average PPM of
When is grass pollen lowest in Stockton, CA?
December has the lowest grass pollen in Stockton, CA with an average PPM of
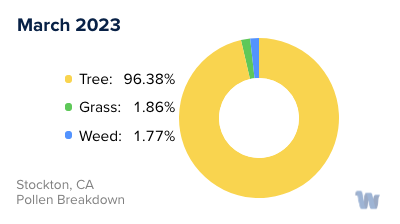
Tree
When is tree pollen highest in Stockton, CA?
April has the highest tree pollen in Stockton, CA with an average PPM of
When is tree pollen lowest in Stockton, CA?
August has the lowest tree pollen in Stockton, CA with an average PPM of
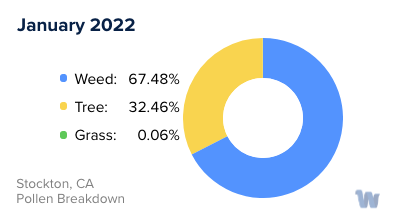
Weed
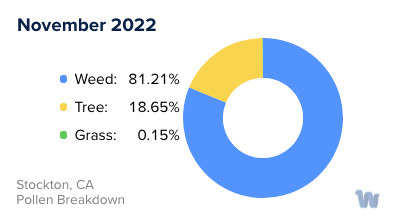
When is weed pollen highest in Stockton, CA?
November has the highest weed pollen in Stockton, CA with an average PPM of
When is weed pollen lowest in Stockton, CA?
February has the lowest weed pollen in Stockton, CA with an average PPM of
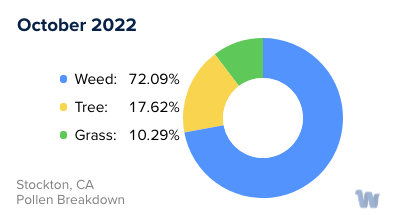
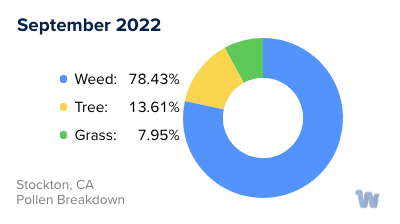
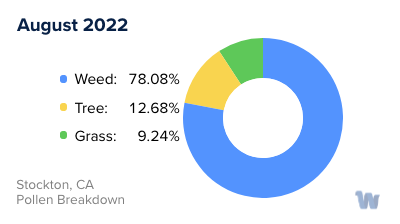
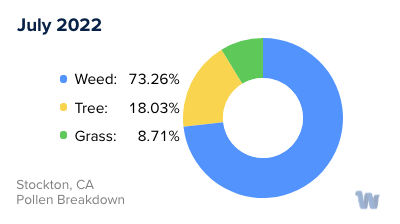
Stockton, CA Pollen Monthly Breakdown by Pollen Type

Pollen and Hay Fever in Stockton, CA
Living in the vibrant city of Stockton, California, means enjoying abundant sunshine, flourishing green spaces, and a rich cultural heritage. However, it also means dealing with a common seasonal issue: pollen allergies, often referred to as hay fever.
Pollen allergies in Stockton are primarily triggered by three main types of pollen - tree, grass, and weed. Each has a different seasonal pattern, giving the city a rather extended pollen season.
Tree pollen is the first to make its appearance each year, typically from late winter into spring. The chief culprits are oak, cedar, and pine trees. These trees release large amounts of pollen that can be carried by the wind for miles, finding its way into noses and eyes, causing familiar symptoms such as sneezing and itchy, watery eyes.
As spring transitions into summer, grass pollen takes the stage. Bermuda grass, Kentucky bluegrass, and ryegrass are some of the common grasses in Stockton that produce allergy-inducing pollen. This period can be particularly challenging for hay fever sufferers as the weather is often dry and windy, ideal conditions for pollen dispersion.
Finally, as summer fades into fall, weed pollen, especially from ragweed, comes into play. While ragweed isn't native to California, it is present and can be a significant hay fever trigger. Other weeds such as English plantain and sagebrush also contribute to the pollen count during this period.
It's also worth noting that Stockton's Mediterranean climate, characterized by hot, dry summers and mild, wet winters, can influence pollen levels. Dry, windy conditions can stir up pollen and distribute it more widely, while rain can help to clear the air.
While pollen allergies can indeed be challenging, understanding the types of pollen prevalent in Stockton and their respective seasons can help residents anticipate and prepare for the allergy seasons, making the most of living in this beautiful city.