Richmond, CA Pollen and Allergy Report for Summer 2023

Pollen Allergy Trends in Richmond, CA
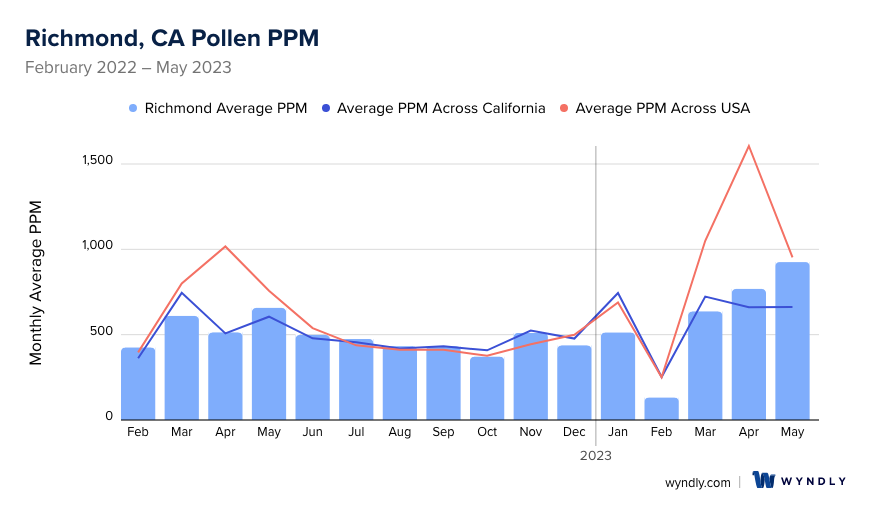
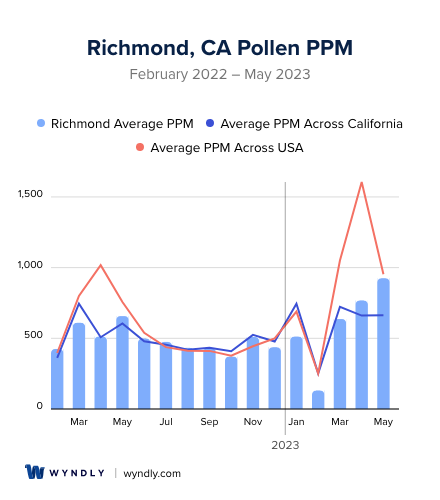
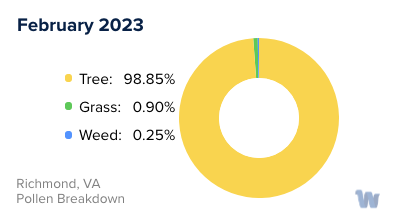
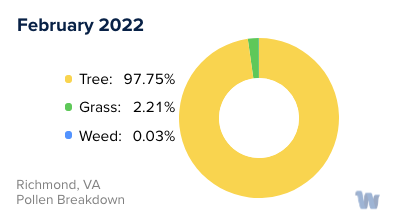
When is pollen lowest in Richmond, CA?
February
Lowest month total PPM
Avg. PPM
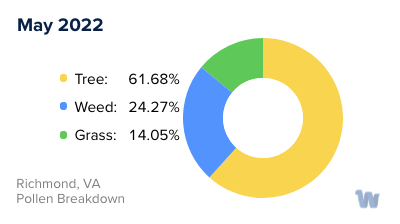
When is pollen highest in Richmond, CA?
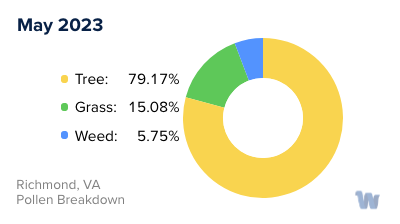
May
Highest month total PPM
Avg. PPM
How does pollen in Richmond, CA compare to California?
Richmond has a lower average PPM than the state of California.
Richmond yearly avg PPM:
California yearly avg PPM:
How does pollen in Richmond, CA compare to the USA?
Richmond has a lower average PPM than the USA.
Richmond yearly avg PPM:
USA yearly avg PPM:
Is pollen worse this year in Richmond, CA?
Spring 2023 was worse than spring 2022.
Spring 2023 PPM:
Spring 2022 PPM:
Average PPM in Richmond, CA
Richmond, CA Pollen and Allergy Breakdown by Month
Grass
When is grass pollen highest in Richmond, CA?
May has the highest grass pollen in Richmond, CA with an average PPM of
When is grass pollen lowest in Richmond, CA?
December has the lowest grass pollen in Richmond, CA with an average PPM of
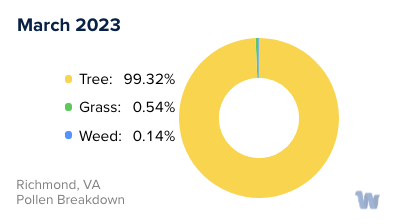
Tree
When is tree pollen highest in Richmond, CA?
May has the highest tree pollen in Richmond, CA with an average PPM of
When is tree pollen lowest in Richmond, CA?
August has the lowest tree pollen in Richmond, CA with an average PPM of
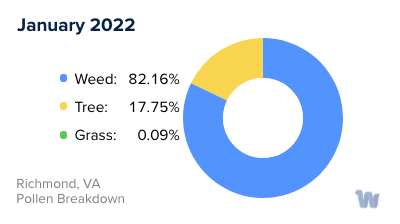
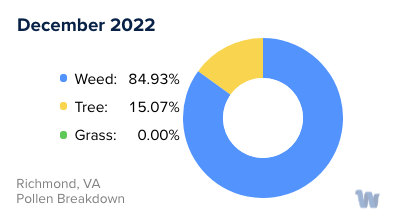
Weed
When is weed pollen highest in Richmond, CA?
November has the highest weed pollen in Richmond, CA with an average PPM of
When is weed pollen lowest in Richmond, CA?
February has the lowest weed pollen in Richmond, CA with an average PPM of
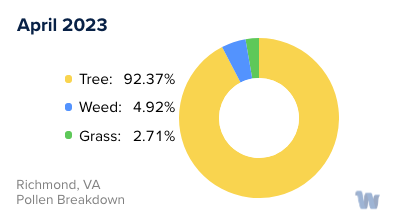
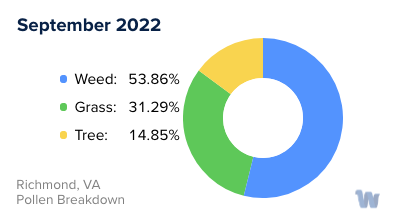
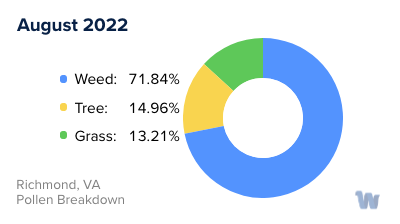
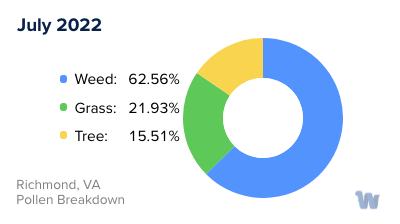
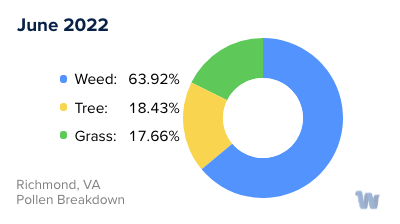
Richmond, CA Pollen Monthly Breakdown by Pollen Type


Pollen and Hay Fever in Richmond, CA
In the heart of Richmond, California, the unique blend of flora and climate presents a vibrant, but occasionally challenging, environment for residents. Among the environmental factors that can impact the health and well-being of Richmond's inhabitants, pollen allergies and hay fever stand out as common issues.
Pollen allergies, commonly known as "hay fever," are the body's immune response to airborne pollen particles. In Richmond, these microscopic troublemakers stem from a variety of local plant life, each with their own distinct pollen season.
One of the main contributors to pollen count in Richmond is grass pollen, particularly from ryegrass and Timothy grass. These grasses typically release their pollen into the atmosphere during the late spring and early summer months. However, their pollination period can extend into the fall, depending on the weather patterns of the year.
Tree pollen is another significant allergen. Richmond is home to a variety of trees, including oak, pine, and cedar, all of which produce pollen. The tree pollen season generally starts in late winter or early spring and can last until late spring or early summer. In particular, oak and pine trees, which are prevalent in Richmond's city parks and streets, are known for their potent pollen.
Lastly, ragweed is a common source of pollen allergies in Richmond. This plant, with its characteristic small, green flowers, releases pollen from late summer to the first frost of fall. Ragweed pollen is incredibly lightweight and can travel long distances, making it a common culprit for hay fever.
To sum up, Richmond's diverse flora results in a varied pollen season. Starting with tree pollen in late winter to early spring, transitioning to grass pollen in late spring to early fall, and culminating in ragweed pollen from late summer to fall, residents experience an extended pollen season. Awareness of these cycles can help Richmond's residents anticipate and understand the seasonal variations in their hay fever symptoms.