Warren, MI Pollen and Allergy Report for Summer 2023

Pollen Allergy Trends in Warren, MI
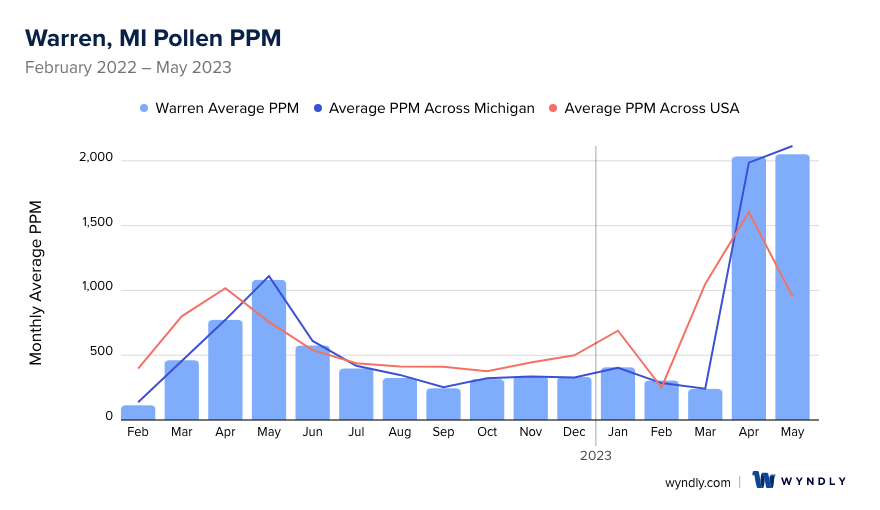
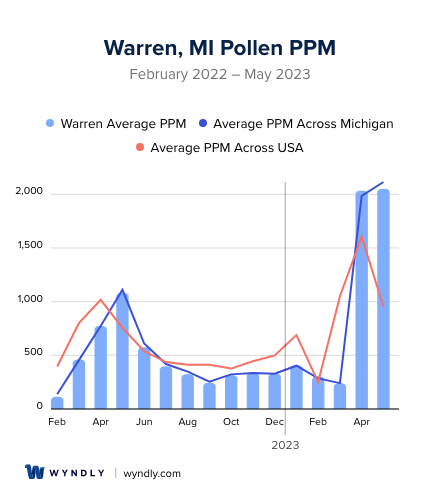
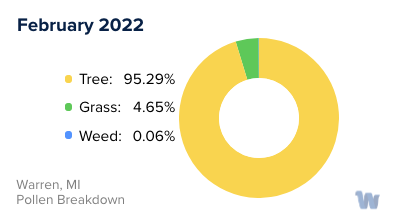
When is pollen lowest in Warren, MI?
February
Lowest month total PPM
Avg. PPM
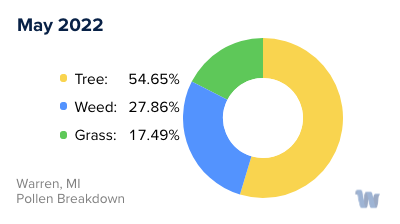
When is pollen highest in Warren, MI?
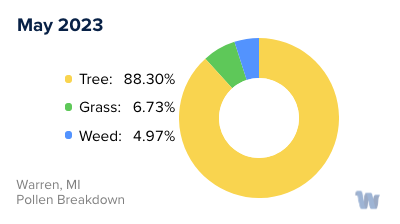
May
Highest month total PPM
Avg. PPM
How does pollen in Warren, MI compare to Michigan?
Warren has a lower average PPM than the state of Michigan.
Warren yearly avg PPM:
Michigan yearly avg PPM:
How does pollen in Warren, MI compare to the USA?
Warren has a lower average PPM than the USA.
Warren yearly avg PPM:
USA yearly avg PPM:
Is pollen worse this year in Warren, MI?
Spring 2023 was worse than spring 2022.
Spring 2023 PPM:
Spring 2022 PPM:
Average PPM in Warren, MI
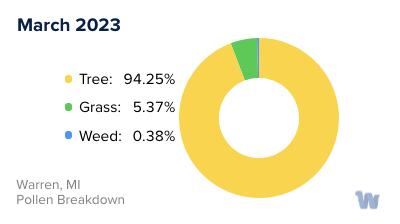
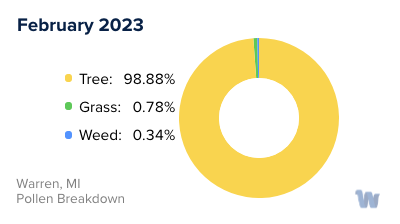
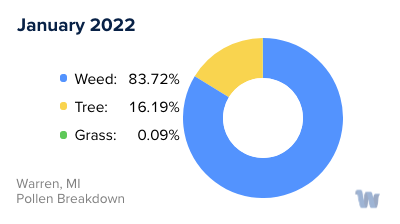
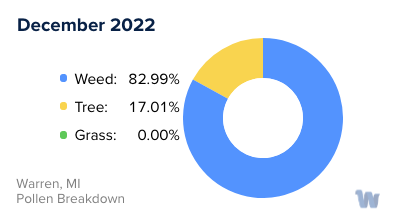
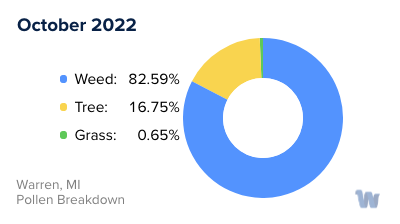
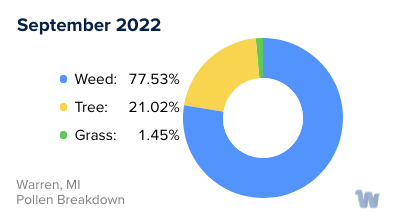
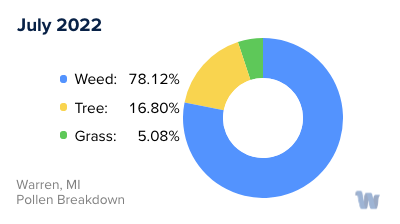
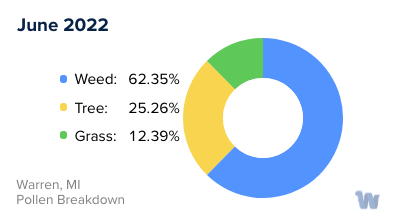
Warren, MI Pollen and Allergy Breakdown by Month
Grass
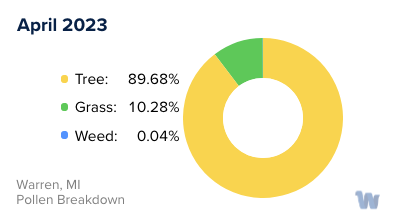
When is grass pollen highest in Warren, MI?
April has the highest grass pollen in Warren, MI with an average PPM of
When is grass pollen lowest in Warren, MI?
November has the lowest grass pollen in Warren, MI with an average PPM of
Tree
When is tree pollen highest in Warren, MI?
April has the highest tree pollen in Warren, MI with an average PPM of
When is tree pollen lowest in Warren, MI?
September has the lowest tree pollen in Warren, MI with an average PPM of
Weed
When is weed pollen highest in Warren, MI?
April has the highest weed pollen in Warren, MI with an average PPM of
When is weed pollen lowest in Warren, MI?
February has the lowest weed pollen in Warren, MI with an average PPM of
Warren, MI Pollen Monthly Breakdown by Pollen Type


Pollen and Hay Fever in Warren, MI
In Warren, Michigan, and the surrounding areas, pollen allergies are a widespread concern. Among these, hay fever is notably common, affecting a large number of residents. Contrary to what the name suggests, hay fever is not caused by hay, nor does it induce a fever. It is, in fact, an allergic reaction to airborne pollens, primarily from trees, grasses, and weeds.
Tree pollens are prominent from late March to June. During spring, trees release minute, oval and circular pollen particles into the air with the purpose of fertilizing other trees of the same species. These lightweight pollens, carried by the wind, can travel astonishing distances and are known to cause allergic reactions characterized by irritation of the eyes, nose, and throat. Notably, certain tree pollen families, such as the family containing oaks, beeches, and birches, as well as the family comprising cedars and junipers, show cross-reactivity, meaning an allergy to one may trigger symptoms from others in the same family.
Following tree pollens, grass pollens take the stage in the summer months. As grasses and flowers rejuvenate, they release copious amounts of pollen into the air. This results in seasonal allergies, causing discomfort for many and leading individuals to remain indoors to avoid exposure.
As summer transitions into fall, ragweed begins to pollinate, and this is when hay fever is most associated with allergy symptoms. Ragweed, scientifically known as Ambrosia, is particularly notorious for its ability to thrive in hostile environments and produce an abundance of pollen. The pollen from ragweed can also travel for miles, making it nearly impossible to escape for allergy sufferers.
In Warren, Michigan, being informed about the types of pollen and understanding the seasons during which they are prevalent can be invaluable for those affected by allergies. This awareness can help individuals to anticipate and manage the seasonal challenges that pollen allergies present.