San Jose, CA Pollen and Allergy Report for Summer 2023

Pollen Allergy Trends in San Jose, CA

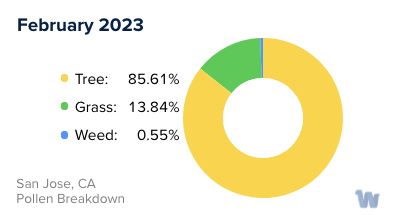
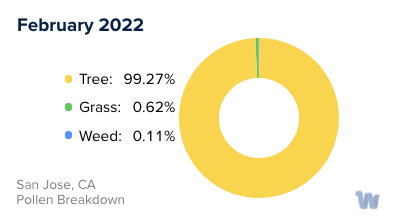
When is pollen lowest in San Jose, CA?

Green down arrow

February

Lowest month total PPM

132.83 Avg. PPM

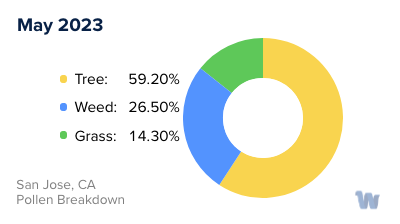
When is pollen highest in San Jose, CA?

Red up arrow

May

Highest month total PPM

753.91 Avg. PPM

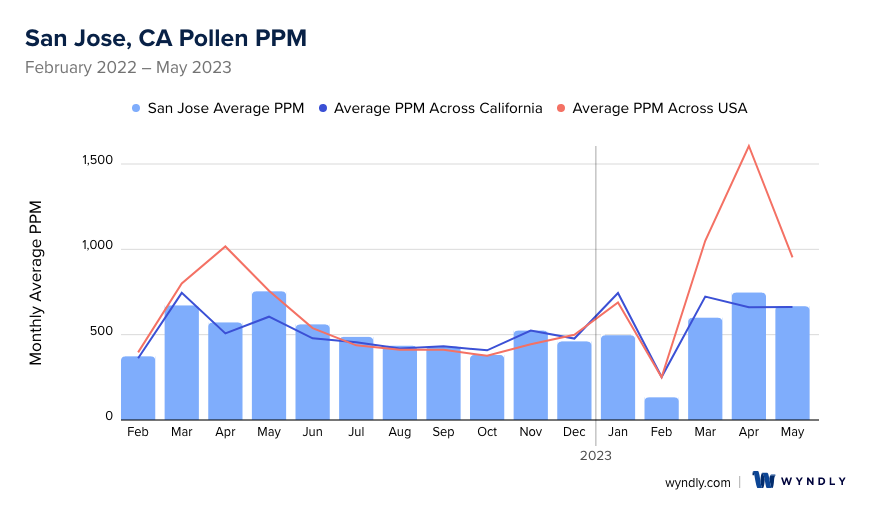
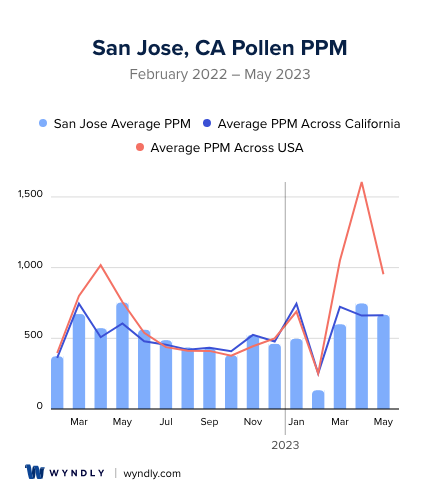
How does pollen in San Jose, CA compare to California?

San Jose has a lower average PPM than the state of California.

San Jose yearly avg PPM: 518.16

California yearly avg PPM: 528.52

How does pollen in San Jose, CA compare to the USA?

San Jose has a lower average PPM than the USA.

San Jose yearly avg PPM: 518.16

USA yearly avg PPM: 664.86

Is pollen worse this year in San Jose, CA?

Spring 2023 was about the same as 2022.

Spring 2023 PPM: 2,012.92

Spring 2022 PPM: 1,996.88

Average PPM in San Jose, CA

San Jose, CA Average PPM San Jose, CA Average PPM

San Jose, CA Pollen and Allergy Breakdown by Month

Grass

When is grass pollen highest in San Jose, CA?

May has the highest grass pollen in San Jose, CA with an average PPM of 285.95

When is grass pollen lowest in San Jose, CA?

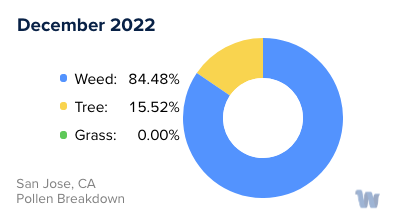
December has the lowest grass pollen in San Jose, CA with an average PPM of
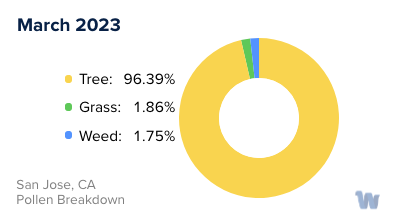
 0

Tree

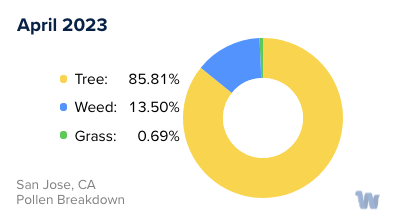
When is tree pollen highest in San Jose, CA?

April has the highest tree pollen in San Jose, CA with an average PPM of 640.8

When is tree pollen lowest in San Jose, CA?

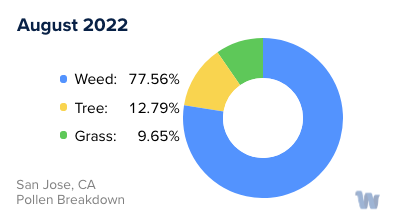
August has the lowest tree pollen in San Jose, CA with an average PPM of
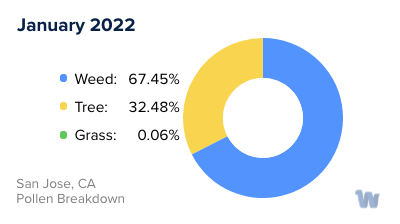
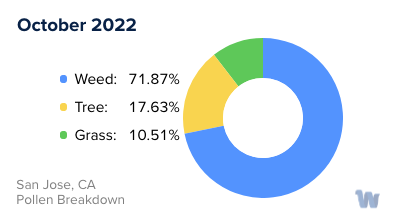
 55.64

Weed

When is weed pollen highest in San Jose, CA?

November has the highest weed pollen in San Jose, CA with an average PPM of 426.24

When is weed pollen lowest in San Jose, CA?

February has the lowest weed pollen in San Jose, CA with an average PPM of 0.4

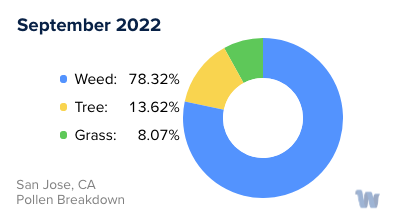
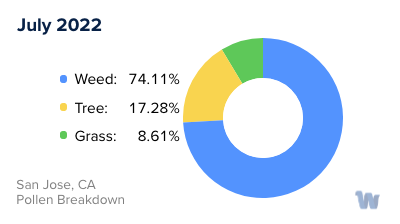
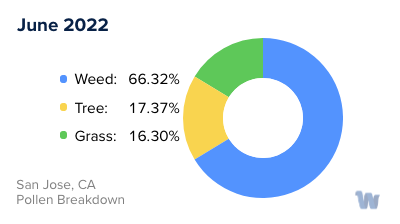
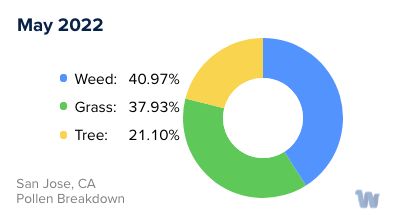
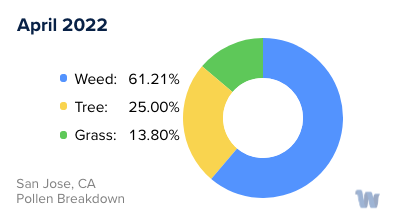
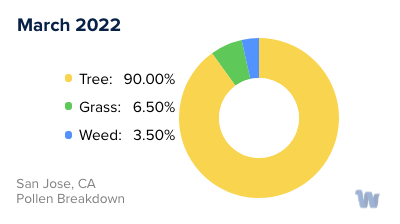
San Jose, CA Pollen Monthly Breakdown by Pollen Type

San Jose, CA Monthly Pollen Breakdown

Pollen and Hay Fever in San Jose, CA

Living in the vibrant city of San Jose, California, we're surrounded by an abundant array of flora that makes our landscapes beautiful but can also lead to a common health concern - pollen allergies or hay fever.

In San Jose, pollen allergies can be triggered by various types of pollen produced by different plants during specific seasons. The seasons in which these allergies peak are primarily spring and fall.

Springtime in San Jose is often associated with blooming flowers and trees, which are the primary culprits for the onset of springtime allergies. Trees such as oaks, pines, and junipers release their pollen into the air, causing hay fever symptoms in many residents. It's not just the trees, though. Grass pollen, particularly from Bermuda grass and ryegrass, also plays a part in spring allergies.

As we move into the summer months, grass pollen levels tend to decrease, offering a brief respite for hay fever sufferers. However, that doesn't mean you're completely out of the woods, as certain weed pollens can still cause problems.

Fall, on the other hand, is infamous for its ragweed pollen. Ragweed is a common plant across California and it releases its pollen in late summer and fall. This can result in a flare-up of allergy symptoms for some individuals. Other fall allergens in San Jose include sagebrush and mugwort.

The changing seasons and the variety of plants in San Jose lead to different types of pollen being present in the air throughout the year. These contribute to the prevalence of hay fever in the city. Being aware of the types of pollen and their seasons can help residents anticipate and manage their allergies, ensuring they can continue to enjoy the beauty of San Jose throughout the year.

San Jose, CA Map

What is Wyndly?

Wyndly is the easiest and most convenient way to fix your allergies forever. As an online allergy practice, Wyndly offers at-home allergy testing and treatment. The main goal of Wyndly is to retrain the immune system to stop responding to allergens, providing lasting relief from allergies.

Here's how Wyndly works:

  1. Identify Allergy Triggers: The first step is to identify the allergy triggers. You can purchase an at-home allergy test from Wyndly, or if you have already done an allergy test elsewhere, you can share your existing test results. This allows the doctors at Wyndly to pinpoint which allergies need to be treated.
  2. Get Treated by a Real Doctor: Using medications that are similar to those used in allergy shots, a doctor creates a unique sublingual immunotherapy treatment plan to desensitize your immune system. This is done using FDA-approved sublingual tablets or clinically proven dosing for oral use.
  3. Live Better Without Symptoms: The prescriptions are shipped to your door, and the doctor works with you until you’re better. Wyndly offers regular online check-ins with US-licensed physicians and 24/7 availability for questions or concerns via text, email, or call.

The treatment plans are personalized based on your specific allergy triggers and aim to treat allergies at their source, rather than just relieving symptoms for a short period. Most people report improvement in as little as one month.

Start with Wyndly today

Wyndly Summer 2023 Pollen Report Methodology

For each city, Wyndly obtained monthly pollen PPMs (pollen grains per cubic meter) for each form (tree, grass, and weed) from February 2022 - May 2023. Data were obtained from Pollen Sense, LLC Automated Particulate Sensors (APS). These sensors automatically detect particulate matter collected from ambient air, and use a neural network algorithm to identify individual pollen species and calculate daily pollen counts.

Yearly averages are calculated by summing the three allergen averages per month of data for a total monthly PPM, summing all monthly total PPMs, then dividing by 12 (month count). Used for per-city average, state average, and total USA average. Season comparisons are done by summing the months of Spring (March, April, May) for 2023 and 2022. If the absolute of the (2023-2022)/2022 is ≤ 0.05, the years were about the same. Otherwise, the more PPM, the worse the season was.

Is Wyndly right for you?

Answer just a few questions and we'll help you find out.

Get Started Today

Pollen and Allergy Reports by City