Santa Ana, CA Pollen and Allergy Report for Summer 2023

Pollen Allergy Trends in Santa Ana, CA
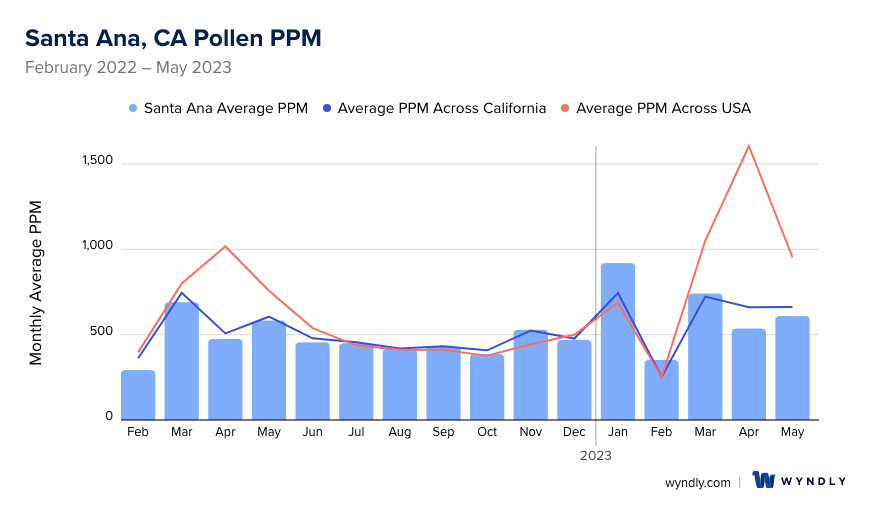
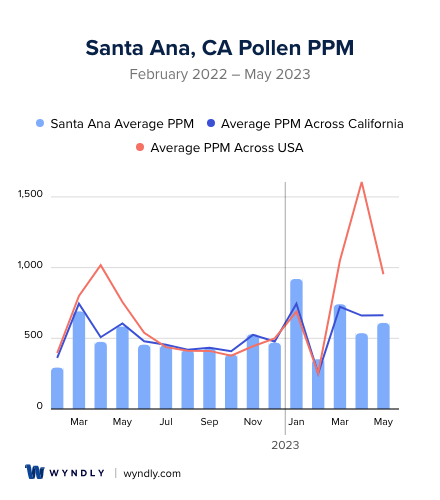
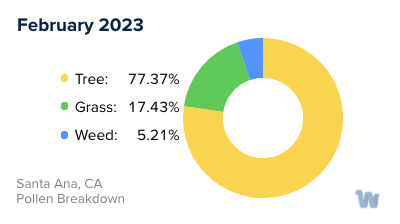
When is pollen lowest in Santa Ana, CA?
February
Lowest month total PPM
Avg. PPM
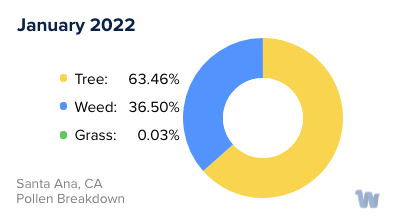
When is pollen highest in Santa Ana, CA?
January
Highest month total PPM
Avg. PPM
How does pollen in Santa Ana, CA compare to California?
Santa Ana has a lower average PPM than the state of California.
Santa Ana yearly avg PPM:
California yearly avg PPM:
How does pollen in Santa Ana, CA compare to the USA?
Santa Ana has a lower average PPM than the USA.
Santa Ana yearly avg PPM:
USA yearly avg PPM:
Is pollen worse this year in Santa Ana, CA?
Spring 2023 was worse than spring 2022.
Spring 2023 PPM:
Spring 2022 PPM:
Average PPM in Santa Ana, CA
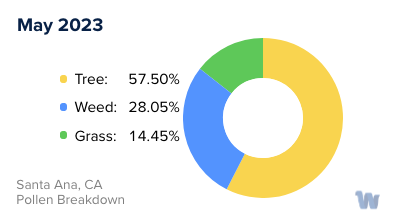
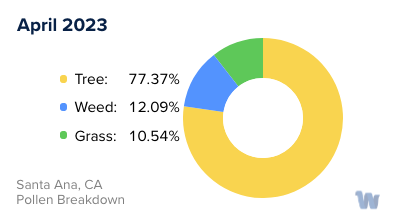
Santa Ana, CA Pollen and Allergy Breakdown by Month
Grass
When is grass pollen highest in Santa Ana, CA?
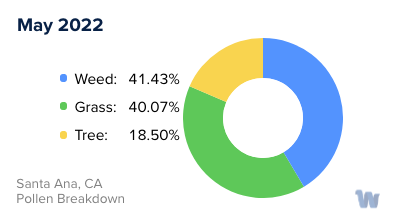
May has the highest grass pollen in Santa Ana, CA with an average PPM of
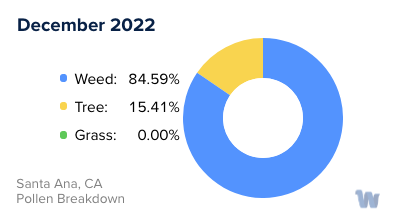
When is grass pollen lowest in Santa Ana, CA?
December has the lowest grass pollen in Santa Ana, CA with an average PPM of
Tree
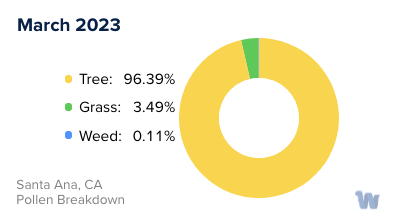
When is tree pollen highest in Santa Ana, CA?
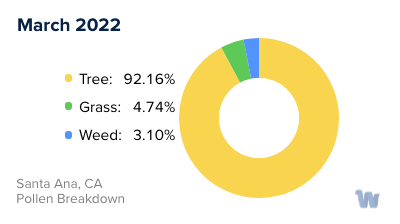
March has the highest tree pollen in Santa Ana, CA with an average PPM of
When is tree pollen lowest in Santa Ana, CA?
August has the lowest tree pollen in Santa Ana, CA with an average PPM of
Weed
When is weed pollen highest in Santa Ana, CA?
November has the highest weed pollen in Santa Ana, CA with an average PPM of
When is weed pollen lowest in Santa Ana, CA?
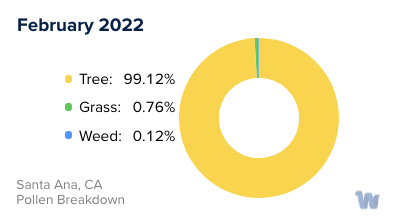
February has the lowest weed pollen in Santa Ana, CA with an average PPM of
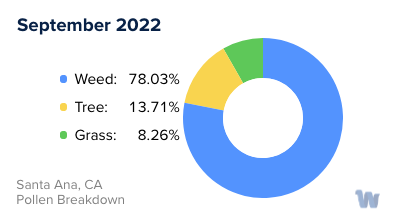
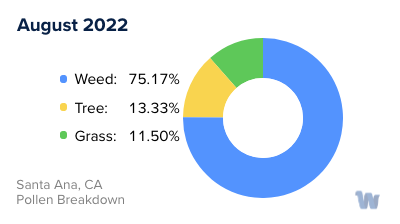
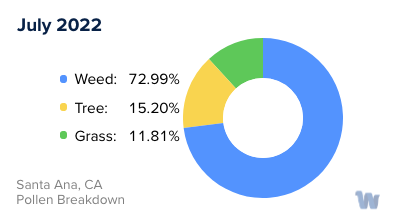
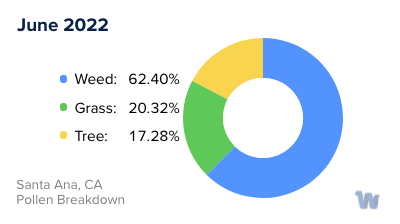
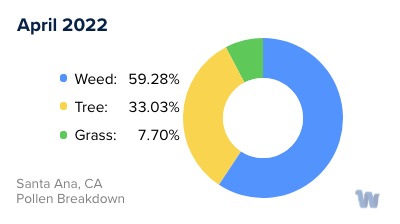
Santa Ana, CA Pollen Monthly Breakdown by Pollen Type


Pollen and Hay Fever in Santa Ana, CA
Pollen allergies, often referred to as hay fever, are a common concern for many residents in Santa Ana, California. These allergies can cause a host of uncomfortable symptoms, ranging from sneezing and a runny nose to itchy, watery eyes. Understanding the types of pollen and their peak seasons can help individuals be prepared and manage their symptoms more effectively.
In Santa Ana, the most common types of pollen come from trees, grasses, and weeds. Each of these has a distinct pollen season, meaning that depending on the time of year, different types of pollen may be more prevalent in the air.
Tree pollen is typically the first to appear each year, often starting in late winter and peaking in the spring. Common trees in Santa Ana that produce allergenic pollen include oak, ash, and pine. It's worth noting that Santa Ana's urban landscape is interspersed with these trees, contributing to the city's tree pollen count.
As spring gives way to summer, grass pollen begins to rise. Grasses such as Bermuda grass, ryegrass, and Timothy grass, found in many parks and green spaces in Santa Ana, can cause allergic reactions. Late spring and early summer are typically the peak times for grass pollen.
Finally, as the summer turns into fall, weed pollen becomes more prevalent. Weeds like ragweed, sagebrush, and mugwort are common sources of allergenic pollen in Santa Ana during the fall months.
It's important to remember that while these are the typical peak times for different types of pollen, various factors can influence the exact timing and severity of each pollen season. Weather patterns, temperature, rainfall, and even wind can all affect pollen levels.
In conclusion, pollen allergies are a significant part of life in Santa Ana, California. By understanding the types of pollen and their respective seasons, residents can better anticipate periods of higher pollen counts and take steps to manage their symptoms accordingly.