Rochester, NY Pollen and Allergy Report for Summer 2023

Pollen Allergy Trends in Rochester, NY
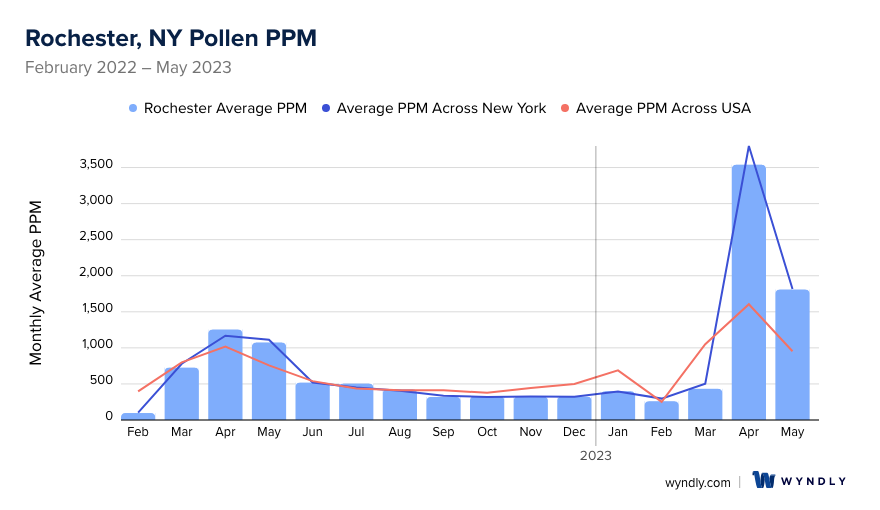
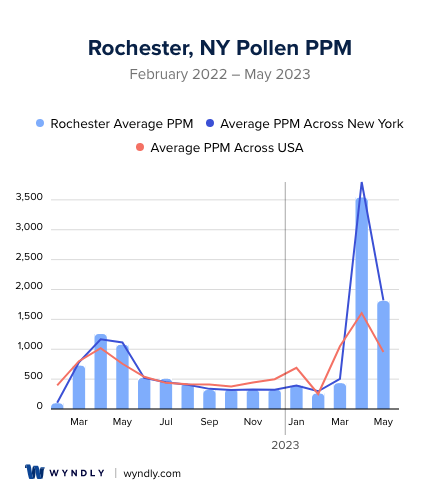
When is pollen lowest in Rochester, NY?
February
Lowest month total PPM
Avg. PPM
When is pollen highest in Rochester, NY?
April
Highest month total PPM
Avg. PPM
How does pollen in Rochester, NY compare to New York?
Rochester has a lower average PPM than the state of New York.
Rochester yearly avg PPM:
New York yearly avg PPM:
How does pollen in Rochester, NY compare to the USA?
Rochester has a higher average PPM than the USA.
Rochester yearly avg PPM:
USA yearly avg PPM:
Is pollen worse this year in Rochester, NY?
Spring 2023 was worse than spring 2022.
Spring 2023 PPM:
Spring 2022 PPM:
Average PPM in Rochester, NY
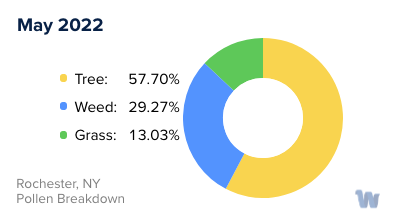
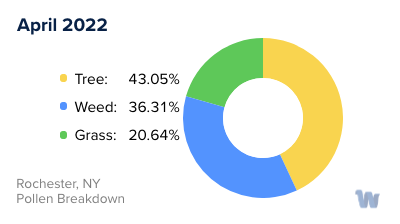
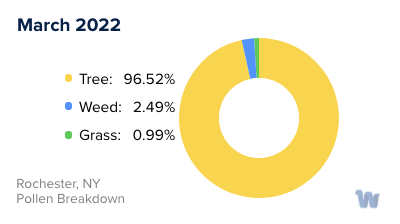
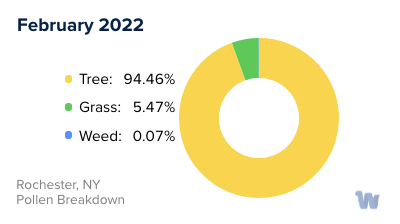
Rochester, NY Pollen and Allergy Breakdown by Month
Grass
When is grass pollen highest in Rochester, NY?
April has the highest grass pollen in Rochester, NY with an average PPM of
When is grass pollen lowest in Rochester, NY?
December has the lowest grass pollen in Rochester, NY with an average PPM of
Tree
When is tree pollen highest in Rochester, NY?
April has the highest tree pollen in Rochester, NY with an average PPM of
When is tree pollen lowest in Rochester, NY?
October has the lowest tree pollen in Rochester, NY with an average PPM of
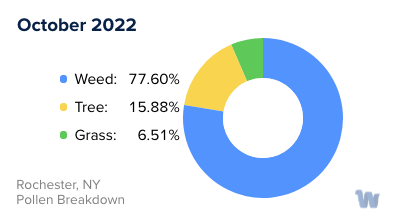
Weed
When is weed pollen highest in Rochester, NY?
April has the highest weed pollen in Rochester, NY with an average PPM of
When is weed pollen lowest in Rochester, NY?
February has the lowest weed pollen in Rochester, NY with an average PPM of
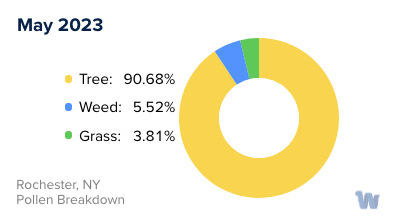
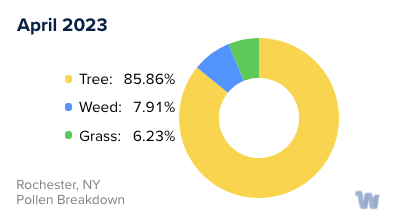
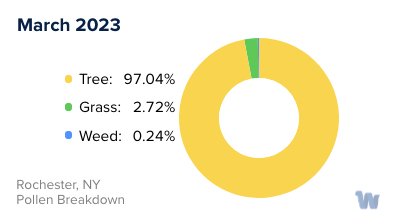
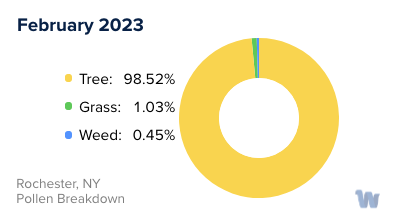
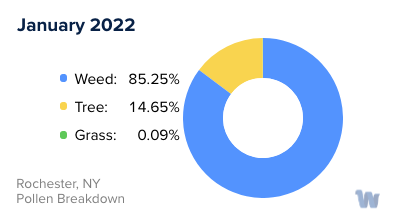
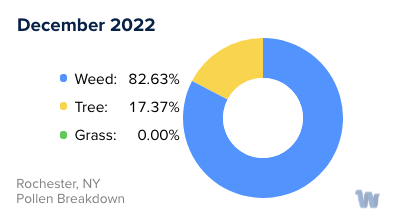
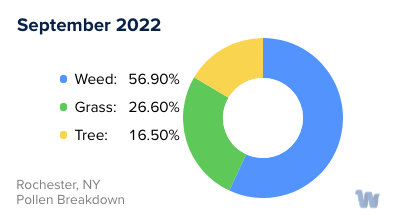
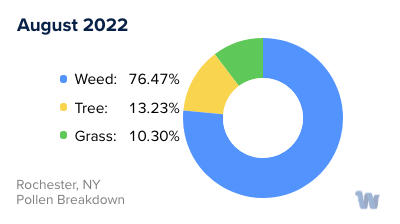
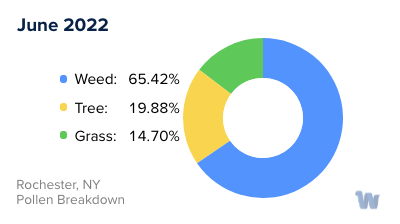
Rochester, NY Pollen Monthly Breakdown by Pollen Type


Pollen and Hay Fever in Rochester, NY
As the gentle warmth of spring pervades Rochester, New York, a less welcomed seasonal guest makes its debut: pollen. With the blossoming of plants and flowers, the air becomes speckled with these microscopic particles, marking the onset of the allergy season. While plants pollinate year-round, the process intensifies during spring and continues through the summer months, leading to a noticeable increase in airborne pollen.
Pollen—a key player in the reproductive process of plants—is predominantly spread by the wind. Grass, trees, and weeds are the primary culprits, generating pollen in mass quantities. When these particles make their way into the eyes, nose, or lungs of a person or settle on their skin, the immune system of those allergic to specific types of pollen perceives it as an invader, prompting typical allergy symptoms like coughing, an itchy throat, a runny nose, and sneezing.
The exact type of pollen causing allergies largely depends on the time of year and the plants that are active. In Rochester, the most active type of pollen in the early spring comes from trees, the first to trigger allergies in those more sensitive to tree pollen. Notorious tree allergens include species such as maple, poplar, juniper, elm, pine, birch, ash, hickory, and cypress.
As we move from mid-spring to late summer, grass pollen takes center stage. Allergy-triggering grass pollen is particularly potent during this period, partly due to lawn mowing activities and the balmy breezes that disperse pollen particles. The main offenders in this category include timothy, rye, and blue grass.
With the arrival of fall, weed pollen starts to appear. Plants like ragweed, nettle, mugwort, fat hen, and sorrel are known to cause allergies during these months. In this way, each season brings its own challenges for those susceptible to pollen allergies in Rochester, adding a unique rhythm to the city's allergy landscape.